
I feel compelled to mention the words “crash risk”. We have been observers of the stock market since 1964. There have been quite a few nut case periods over the intervening 53 years, however, the insanity today is as extreme and as crazy as any I have ever seen, cautions Alan Newman, market timer and editor of CrossCurrents.
Margin debt has now more than doubled in the last six years and tripled in less than nine years. The most important takeaway from our analysis of margin debt and how it impacts the stock market is that similar rapid climbs and record runs led to the bear markets of 2002-2003 and 2008-2009.
Margin debt nearly tripled from 1997 into the tech mania peak in March 2000. The subsequent dénouement cut the major averages in half and absolutely savaged Nasdaq, leaving it for dead down an astounding 80% in the fall of 2002. And then….? Margin debt tripled again into the summer of 2007, followed by yet another halving of the major averages and a 56% decline in Nasdaq.
By the end of 1999, less than ten weeks before the tech mania peak, total margin debt equaled 2.5% of gross domestic product (GDP) by far the highest since the 1929 highs. There was a repeat performance in 2007 when margin soared to over 2.9% of GDP.
This time around, margin debt has gone as high as 3.15% of GDP. For many years, we had arbitrarily set 2% as a “danger signal” but in the modern era, we admit that 2.5% may function as a better signal.
However, if we adjust our signal higher, where does that leave repeated readings this year of 3% and higher? Obviously, today’s levels represents danger in the extreme.
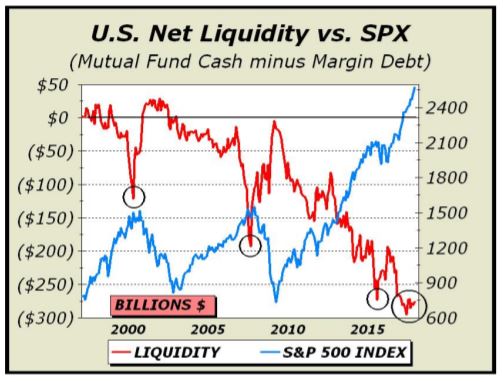
We can also determine quite easily how the current environment of excessive margin debt matches against the past simply by measuring both margin debt and the S&P 500 adjusted for inflation. The S&P 500 constituents represent over 80% of the U.S. stock market, thus the comparison should be fair.
The S&P had advanced 19.2% adjusted for inflation. Margin debt is up more than twice as much—40.6%—illustrating the extent to which the stock market has relied on leverage.
For much of this bull market, we maintained a subsequent bear market would nowhere near match the previous two but what we’ve seen in 2017 has changed our outlook significantly.
The odds are quite high that the next bear market will once again cut stock prices in half. Our long standing bear market target of Dow 14,719 is now nearly 40% down from here.
As well, we have referred to Shiller’s cyclically adjusted P/E ratio (CAPE) as an excellent measure of valuation. We are convinced that CAPE will eventually suffer a reversion to the mean, down 47.5% from here. The median is down 49.5%. CAPE is at its second highest back to 1882.
The combination of extreme valuation and extreme leverage are a perfect recipe for disaster. Our concerns that
another mania might be underway began in September 2013, when margin debt took out the record 2007 high. We have been climbing out on a limb since then. When that branch breaks, it’s going to look a lot like the previous two bear markets. It’s a very long way down.


