
The stock market is still bullish but it’s flashing yellow caution signals that are even brighter than before, asserts market timing experts Mary Anne and Pamela Aden, editors of The Aden Forecast.
Here’s the deal; this month several of the stock indexes broke below their 200-day and/or 65-week moving averages (see Chart 6, below).
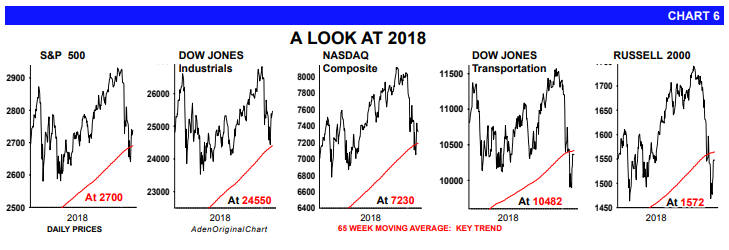
These were bear market signals. But most are now back above these averages, thanks to the early November rebound, which is currently vulnerable as stocks continue to flip-flop.
So we’ll be watching to see if they can stay above these levels, or not. (The moving averages are listed on chart 6, above) If they do, the market will remain technically bullish. If not, the stock market will be sketchy, possibly turning bearish.
The bottom line is this —we have a record high at 26,828 on the Dow Industrials, which was reached on Oct. 3, and a low at 24,443, hit on Oct 29. For now, these are the highs and lows and whatever happens in between these levels will just be more, ongoing volatility.
So the swings could be wild, but this has happened before. Note that the S&P500 (see Chart 9, below), has had two steep declines during the current bull market that started in 2009.
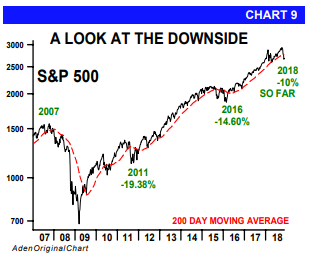
These happened in 2011 and 2016 when the S&P declined 19.38% and 14.60%, respectively, and then the market headed higher. A similar situation could be happening again, but time will soon tell — and those highs and lows will be important in determining the final outcome.
We realize we currently have a large cash position, but with the markets so volatile, we feel it’s warranted. This will be temporary, but it’s best to be on the sidelines with a good portion of your funds in cash for now. That way you’ll have these funds available for good investment opportunities as they arise.


