
The Dow Theory was originally referred to as “Dow’s Theory,” since it was based on the thoughts and writings of Charles H. Dow who, along with Edward D. Jones, formed Dow Jones and Company in the 1880s, explains Jon Strebler, contributing editor to The Aden Forecast.
The “Theory” itself was actually established by Dow’s good friend Samuel A. Nelson, who wrote about Dow’s many editorials dealing with how bull and bear markets operate and can be identified. As such, Nelson was the first proto-Dow theorist. But it was really Wall Street Journal editor William P. Hamilton who organized Dow’s methods into the Dow Theory that we know today.
Following his death, the baton was passed to Robert Rhea, who some — including Richard Russell — considered the finest Dow theorist of them all. Together with Russell and E. George Schaefer, these men’s writing form the guidebook to “Dow’s Theory.”
More than 100 years after its creation, is the Dow Theory still relevant? Many suggest that its time has long passed, yet it has been instrumental in helping investors stay with long bull markets, and avoiding the crushing losses that bear markets can bring. With that in mind, what does the Dow Theory tell us now about the future direction of the current, confusing stock market?
Well first, let’s recall that the Theory is about much more than what the Industrial and Transportation Averages do. “Bear market signals must not be oversimplified. Over and over again, the great Dow Theorists have warned us not to take a shallow, mechanical reading of the Averages while disregarding phases, duration, and extent of market movements,” according to Russell.
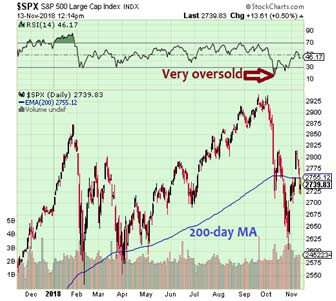
Now, our current bull market is clearly in its third phase, where stock prices go beyond proven values; with a duration longer than any other in history. And with the S&P 500 having hit very oversold levels, down 11.4% from its October highs, and falling well below its 200-day moving average, this latest correction’s extent easily qualifies as a secondary reaction.
But then there’s the issue of value; are stocks over- or under-valued? Charles Dow himself wrote “The best way of reading the market is to read from the standpoint of values.” His friend S.A. Nelson said “Value… is the determining factor in the long run.
Prices fall because values are falling.” Hamilton was “a shrewd judge of values,” Richard Russell wrote in his 1960 book The Dow Theory Today. Russell himself said “…the cycles of stock values tend to extremes,” and often wrote about the importance of buying stocks when they are “great values.”
When talking about whether stocks are a good value, investors historically consider the S&P 500’s price to earnings (P/E) ratio, price to sales ratio, average dividend yield, and price to book value.
Below is one of those in chart form, where the current price to sales ratio of 2.17 compares to 0.8 when the bull market started ten years ago, indicating that stock prices are very overvalued now.
The others are similar: Shiller P/E ratio at 31.53 now vs. 15 in 2009; price to book value 3.36 now vs. 1.8 in 2009; dividend yield 1.86% now vs. 3.11% in 2008. Their message is all the same: US stocks at current prices are anything but “great values.”
Additionally, we’ve seen all of the major stock indices fall decisively below their 200-day moving averages for the first time in years, along with the A/D line and Richard Russell’s beloved PTI falling below their respective MAs. Thus, all of the ducks are in a row for the start of a bear market, awaiting only the action of the Dow Averages to seal the deal.
And then there’s this barely known fact: “Perhaps the most common misconception about the Dow Theory is that it implies waiting for a bear signal in the Averages before selling. Nothing in the writings of Hamilton or Rhea remotely suggests such a dangerous method of operation. Most Dow Theorists would gladly sell out of a market which has all the earmarks of a third-phase climax; they never wait for the actual bear market signal.”
The author? Richard Russell, the legendary market technician. We can argue over the “climax” part, but nevertheless I recommended that my subscribers lower their equities allocation to 30% in the rally from October’s lows, and hope they actually did that.
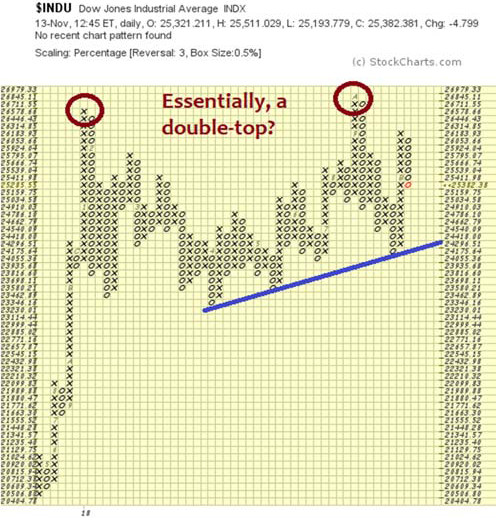
As such, and given all of the above discussion, I would consider a break below the blue uptrend line, and certainly a fall below October’s closing low of 24,443, to be a legitimate sell signal in the true spirit of the Dow Theory, regardless of any other factors.
Want to wait for the Averages to confirm a bear market in the strictest, mechanical sense before selling? In that case, you’ll have to wait for the Industrials to 1) finish this rally, then 2) close below October 29th’s 24,443 close, and 3) for the Transports to roll over and then close below their October 24th’s low of 9,905.
And this assumes that the rally off of the October lows 4) lasts at least a few weeks, satisfying those earlier requirements about duration and extent. If it doesn’t — well, then the picture gets a bit muddier.


