
Shares of Amazon, Inc. (AMZN) last Friday set a new year-to-date high of $1,838.58, as the mega-retailer capitalized on a pair of well-received media reports, notes Bernie Schaeffer, editor of Schaeffer's Investment Research.
First, traders priced in relief after learning that CEO Jeff Bezos would retain 75% of his stock in the company under the terms of his divorce, while maintaining sole voting authority over both his and ex-wife MacKenzie's stakes.
Then, The Wall Street Journal cited sources claiming that WPP doubled its spending on Amazon search ads last year, and "about 75% of that money came from Google search budgets."
As the No. 3 weighted component in both the S&P 500 Index and the Nasdaq-100 Index, with its tentacles extending into sectors ranging from consumer staples and consumer discretionary to media content production and cloud computing services, AMZN provides a breadth and depth of sector exposure that's hard to find in too many other single stocks.
But with a per-share price tag now approaching $2,000, new shareholders at this stage in the game will certainly pay up for the privilege of obtaining this built-in diversification.
That said, AMZN's broad-based reach into U.S. households — and, increasingly, businesses — is reason enough for any active investor to keep up with its stock chart as a matter of course.
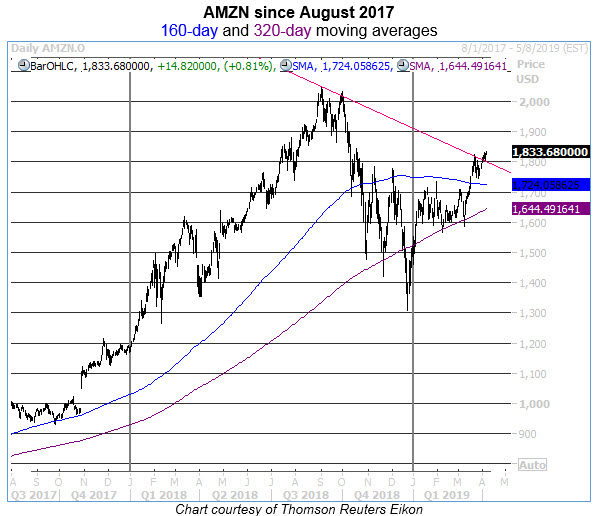
With that in mind, we've rounded up some of the major trendlines and price points in play for Amazon around its current levels.
- 1,644.50 is home to the stock's rising 320-day moving average, which has played a key supportive role in 2019.
- 1,691.74 marks a 50% retracement of Amazon's decline from its Sept. 4 closing high to its Dec. 24 closing low.
- 1,700 is where front-month options traders are focusing their attention, with 5,027 calls and 4,181 puts in open interest for the April series.
- 1,724.08 was Friday's closing level for the 160-day moving average, which briefly acted as support in late 2017 before emerging as resistance in the fourth quarter of 2018.
- 1,801.19 is the site of a descending trendline connecting AMZN's lower highs in early and late September 2018. After another rejection here in late March, the stock broke out above this level on April 1, then re-tested it as support twice last week.
- 1,802.36 is also in the neighborhood of this recently vanquished trendline, and marks a round 20% year-to-date advance for Amazon shares.
- 1,832.25 is the per-share price corresponding with a round $900 billion market cap, which could serve as a bit of a psychological sticking point in the short term.
- 1,845 is the precise intraday high from last Oct. 17, as AMZN was catching what would be its last bounce in a while off its 160-day moving average.
- 1,845.45, meanwhile, represents a 10% correction from the Sept. 4 intraday record high.
- 1,849.98, which lies nearly flush with the round 1,850 half-century level, marks a double of AMZN's April 2017 monthly closing price of $924.99.
- 1,879.36 is a 20% year-over-year gain from the April 2018 month-end close.
- 1,880.05, right in the same neighborhood, was the intraday peak from last July 27.
Going forward, traders should watch the stock's progress around these areas for breakouts and/or rejections at overhead levels and catches and/or breaks of support below.
Combining this technical analysis with some of our preferred momentum-based indicators — like the Average Directional Index (ADX) and Relative Momentum Index (RMI) — should provide valuable insight as to whether this outsized player in the U.S. equities market is heating up or starting to run cold.


