Using price-to-earnings ratio as a valuation tool can help find great values for long-term investors, notes Julie Carnevale of F.A.S.T. Graphs.
Let’s look at Aflac (AFL) as our example for using the P/E ratio to identify significant undervaluation. In order to accomplish this goal, we are going to properly utilize the P/E ratio as a relative measuring stick.
As previously pointed out, looking at the P/E ratio in a vacuum is an ineffective and mostly irrelevant way to use it. The P/E ratio only brings value to security analysis when it is applied and looked at relative to the past, present, and future earnings power of the company or companies being analyzed.
The P/E ratio is a measurement of current valuation in the static sense, but it is a more relevant measurement of valuation when looked at dynamically relative to the future growth potential of the underlying business (earnings growth). Because only when the future growth of the business is correctly ascertained does the P/E ratio draw a true picture of valuation.
- The simplest definition of the P/E ratio is the mathematical formula: P/E = Price divided by Earnings.
- This second definition relates to the P/E ratio as a measurement of the cost of earnings: P/E = How many dollars you must pay to buy one dollar’s worth of a company’s earnings.
- This final definition relates the P/E ratio to the time use of money: P/E = How many years in advance you are paying for this year’s earnings.
Trading at Half its True Worth
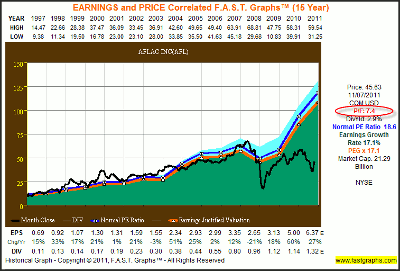
The following 15-year historical earnings- and price-correlated F.A.S.T. Graphs™ clearly show that the market has traditionally provided a modest valuation premium on Aflac’s shares relative to its earnings justified valuation line (the orange line).
Aflac has achieved a consistent above-average earnings growth rate of 17.1%. Therefore, since calendar year 1997 and up through calendar year 2008, the market applied a normal P/E ratio of 18.6 on Aflac’s shares.
However, the great recession of 2008 changed all that. Yet even after earnings have rebounded strongly in 2009 and 2010, and expected to continue for 2011, the market stubbornly applies a current P/E ratio that is less than half its historical norm (see red circle on graph below).
Even when considering today’s significant undervaluation of Aflac’s shares, their long-term shareholders have been handsomely rewarded in excess of the general market (as measured by the S&P 500).
Aflac is a Dividend Champion, and on October 26, the Board of Directors of Aflac announced a 10% dividend increase marking their 29th consecutive year of dividend increases.
NEXT: Interpreting the Estimated Earnings and Return Calculator
|pagebreak|Interpreting the Estimated Earnings and Return Calculator
The F.A.S.T. Graphs™ estimated earnings and return calculator is designed to offer short, intermediate, and long-term estimates of a company’s earnings growth potential.
The graph contains one year of historical price correlated to earnings, then an actual forecast number for the current year (note that since there only two months left in the current year, this forecast is, more likely than not, very accurate). Then the actual consensus forecast for the next year’s earnings is plugged in, and then from that point, future earnings are grown by the five-year consensus estimated earnings growth rate.
Therefore, in our Aflac example, we show earnings of $6.37 for calendar/fiscal year 2011, followed by $6.60 for calendar/fiscal year 2012, which represents approximately a 5% growth rate. From this point, future earnings are compounded at the 9% consensus estimate by 20 analysts reporting to Capital IQ.
Although these are analyst’s estimates, we also want to point out that these numbers are consistent with the guidance that Aflac’s management has provided.
However, as an interesting aside, the consensus of leading analysts reporting to Zacks expect Aflac to grow earnings at 10.5%, and Zacks itself forecasts 11% growth, while the Value Line Investment Survey forecasts earnings growth of 13%. Consequently, a strong case can be made that the forecasts on the following graphs are conservative representations for Aflac’s future earnings growth.
Once again, assuming that they are, this implies a potential five-year estimated annualized total return of 25.9%.Of course, this also assumes that Aflac meets our target estimates, and that the market applies a normal P/E of 15, or twice what it currently applies.
When properly utilizing the P/E ratio to evaluate our Aflac example, today’s current blended price-to-earnings ratio of 7.4 makes no logical sense. The only way it could make sense would be if future earnings were expected to be significantly lower than they are today, not greater as consensus now expects.
Yet since Aflac’s historical record and the expectations for its future record are both strong and above average, the rational thinker must assume extreme undervaluation is present today. To state this as clearly as possible, we believe that a fair-value P/E ratio for Aflac should be at least 15, which suggests that the price should be double what it currently is trading at.
Furthermore, the rational thinker would also logically assume that there exists a significant opportunity for a P/E ratio expansion in the future. Growing earnings and the rational expectation of P/E expansion augurs extremely well for significantly above-average future long-term returns. Moreover, today’s extreme low valuation also implies a lower than historical normal level of risk.
As Warren Buffett has said: “Investing is most intelligent when it is most businesslike.” And the future business prospects for Aflac appear very promising.
Consequently, we believe that all Aflac shareholders need to do today is exercise a little bit of intelligent patience and the rewards should be great and the risks manageable to low.
Subscribe to F.A.S.T. Graphs here…
Related Reading:


