

Shares of the agricultural giant have fallen to a critical support level, and all traders—bullish and bearish—can find low-risk opportunities to capitalize on the coming test of this area.
Traders who enjoy playing price off major inflection (decision) points have a potential opportunity forming here in Monsanto (MON), an important agricultural company, as price now sits atop a critical support/reference area at $63.00 per share.
Let’s see how this area has become important and what the implications would be if the area holds… or breaks soon.
First, the shorter-term daily chart:
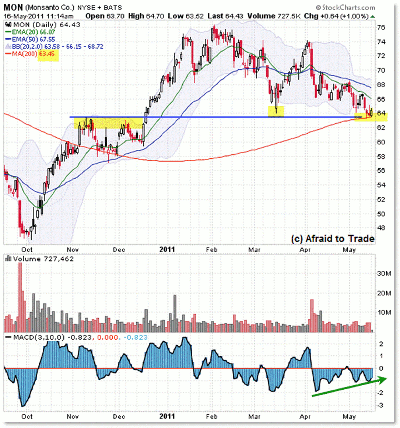
Click to Enlarge
There are two simple factors drawing our chart eyes to the $63 level:
- The rising 200-day simple moving average (SMA) at $63.45
- The “price polarity” zone near $63, as shown from the highlighted tests of this area
Many investors and traders refer to the 200-day SMA as the basic “dividing line” between a bull and bear trend, though that’s probably an oversimplification of the moving average.
Still, traders are more likely to be bullish above the 200-day SMA and bearish under it, which can lead to self-fulfilling prophecies and feedback loops.
Beyond the 200-day SMA, we have the “price polarity principle” at work, which states that “old resistance becomes future support,” and vice versa.
The $63 area was a key resistance line in 2010, and once buyers broke through the zone in December, we saw a $10 rally in the stock that ended with divergences along with trend line and exponential moving average (EMA) breakdowns.
We’re also seeing a slight positive momentum divergence forming into the support area, which adds a bullish touch to the chart, but the most important thing to watch is price.
Either this level will hold or it will not, which allows for a tight stop for buyers and a similar tight stop for sellers if this level fails to hold.
NEXT: Another Reason Why That $63 Level Is Critical
|pagebreak|The $63 level is a key reference price that goes beyond the daily chart:
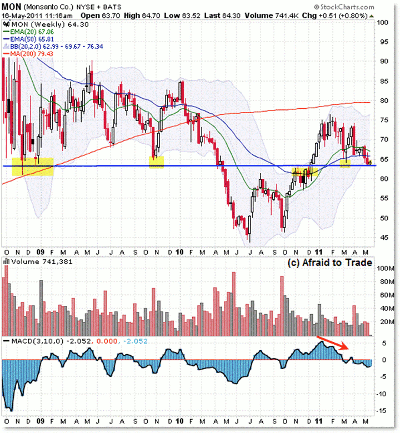
Click to Enlarge
Again, keeping it as simple as possible, we see the $63/$64 level as defining the lows in both 2008 and 2009 (support) and then temporarily in late 2010 as providing overhead resistance.
This kind of trade set-up/opportunity is akin to what Mark Douglas shares in Trading in the Zone, where he describes price as coming into a decision node/inflection point that has to go one way or the other (it cannot stay at $63 forever).
A bullish trader looks to capitalize on this important level by expecting a bullish bounce higher, and if positioned, he/she will place a stop nearby (perhaps under the $60 level) in the event buyers fail to defend the support level.
A bearish trader similarly seeks to profit if this level fails and price begins heading lower than $63, preferably under $60. The trader would then place a similar stop-loss (protecting a short position or long put play) just above $63 (perhaps above $65).
This type of logic builds on Douglas’ quote “You don’t have to know what will happen next to make money,” as playing off critical inflection points provides low-risk opportunities for those willing to take a bet as to which side—be it the bulls or the bears—will win.
Either way, it should be interesting to watch what happens next at this critical pivot level in Monsanto’s share price.
By Corey Rosenbloom, trader and blogger, AfraidToTrade.com


