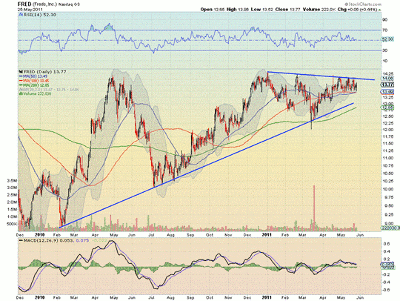
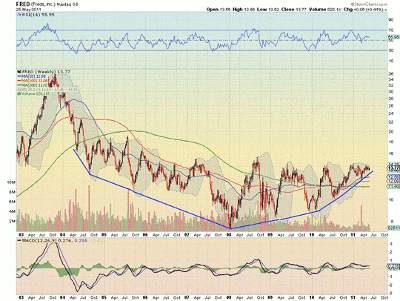
With clearly defined support levels on the daily chart and a solid long-term pattern on the weekly, shares of retailer Fred’s Inc. (FRED) are in play for daytraders and longer-term traders alike.
Retailer Fred’s, Inc. (FRED) reported earnings yesterday (Thursday) morning and either beat expectations or fell short. I don’t really care!
Actually, they reported and guided in line…boring! But knowing that the company was about to report was only a reason to not have traded it yet. Now that it has reported, it’s fair game.
When I look at the chart of the stock on a daily basis, there is a nice consolidation occurring at resistance of the falling trend line from January.
The touches to that trend are becoming more frequent and the pullbacks shallower with the 50- and 100-day simple moving averages (SMAs) as support.
Analysis of this chart would focus on three points. First, a break above the trend line would trigger a buy looking for a move to the range of $15.75-$16. A failure there would trigger a short looking for support back at the SMAs or the uptrending support line below.
The second point is the two SMAs. Holding above them triggers a buy signal with resistance at the falling trend line, and falling below it triggers a sell signal with support at that rising trend line.
The third point is the rising support trend line. A hold above triggers a buy and a fall below triggers a sell with support at $12.25-$12.30, followed then by $11.75. That is what the daytraders care about.
But back it up a bit and look at the weekly chart below. That is a seven-year rounded bottom formation.
Now that is a big butt! This is a stock for those with longer-term time frames. The basing shows a top around $15 that it needs to break, but from a weekly time frame, it looks very appealing for a long position.
A move above $15 looks poised to head higher, eventually targeting $22.50 or more.
By Greg Harmon, trader and blogger, DragonflyCap.com


