

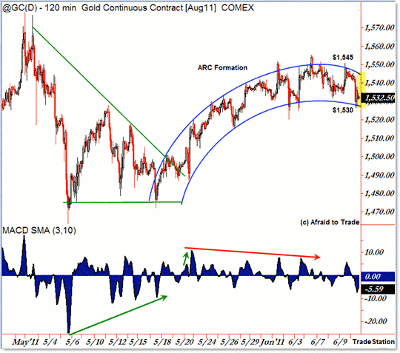
A classic arc formation on the gold futures chart has clearly defined support and resistance levels, allowing short-term traders solid reference points for basing their trades. Here are the key levels to watch.
At the start of last week, I showed the arc pattern trend line boundaries that were forming at the peak of the intraday arc in gold prices, and this week, the arc continues right on schedule.
Let’s take a look at the updated/current arc pattern and then see where that structure takes us on the daily support chart.
Click to Enlarge
As I noted last week, the upper boundary was roughly $1,550, while the lower boundary was $1,525.
Price continued to respect these boundaries appropriately, giving intraday traders quick opportunities to play scalp moves off these developing trend line boundaries.
Not much has changed, as the boundaries have now defined themselves more clearly this week at $1,545 and $1,525/$1,530, as seen above.
The analysis is the same: As long as price continues to respect (bounce between) these levels, then you have your roadmap or game plan for intraday/short-term trading opportunities.
Should price break firmly through either of these boundaries, then it would suggest pattern completion and a breakout/impulse phase would emerge, allowing for implementation of breakout trading strategies.
So that’s the intraday structure—the arc—but let’s take a look at where that leaves us currently on the daily chart.
Article Continues on Page 2
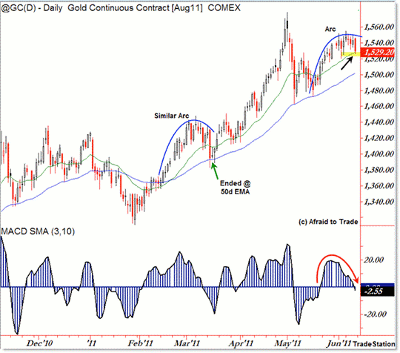
|pagebreak|Gold Futures - Daily Chart
Click to Enlarge
Before discussing current levels, I wanted to show the example of the prior arc pattern from February and into early-March 2011.
Though the rally phase was longer than present, daily (and intraday) gold prices formed a similar arc with negative divergences inside the pattern (as we have now).
The downside action continued, culminating in a strong selloff bar that slammed the rising 50-day exponential moving average (EMA) at the confluence of the $1,400 round-number support zone.
The test of the confluence support ended the retracement phase, and price quickly broke the upper arc trend line, triggering a breakout buy signal that preceded the April rally.
And now presently, we have a well-defined arc that is now coming into the support at the rising 20-day exponential moving average (EMA) at $1,530.
It is possible that buyers will enter here to support prices at the 20 EMA, but if they fail to do so, expect a similar retest (deeper retracement) of the rising 50-day EMA, similar to what took place in March.
It would then be up to buyers to again try for a retracement buy at the confluence of the 50-day EMA and the $1,500 round-number support. (Strange how the structure aligns like that again.)
In other words, watch the current price at $1,520, and if there’s no rally here, then expect the rounding arc to continue, leading to another retest of the rising 50-day EMA. Watch what happens at the 50-day EMA at $1,500 for clues as to what to expect from there.
Continue watching gold on the hourly/intraday time frames with regard to this arc formation, and trade appropriately. Don’t get ahead of the arc!
By Corey Rosenbloom, trader and blogger, AfraidToTrade.com


