Popular ETFs like USO and XLE get most of the headlines, but the charts show that a lesser-known but highly liquid ETF has steadily outperformed the rest, making this fund the most profitable way to trade energy.
We recently ran an article about how trading gold (using the SPDR Gold Trust (GLD), for example) has been more profitable than holding gold stocks in general. Well, the opposite has held true for the oil and energy complex.
The United States Oil Fund (USO) hasn't been the best way to pick up gains in this sector. The only time in recent years that crude oil or USO has outperformed key baskets of energy stocks was in the huge bubble run-up in 2008—and even then it wasn't by much.
The two major energy ETFs that we'll focus on for comparison are the Select Sector SPDR - Energy (XLE) and SPDR S&P Oil & Gas Exploration ETF (XOP).
All of these funds (including USO) are liquid in terms of volume and have reasonable option pricing. Average daily volume is 22 million for XLE, 14 million for USO, and seven million for XOP.
XLE is based on the S&P Energy Select Sector Index, which is comprised of companies involved in the development or production of energy products and that are components of the S&P 500 Index. So it definitely leans to more of the broad-based, large-cap diversified energy companies. It is also fairly heavily market-cap weighted, so the top two holdings, which are Exxon Mobil (XOM) and Chevron (CVX) comprise over 30% of its assets.
XOP is another SPDR ETF and is designed to track the S&P Oil & Gas Exploration & Production Select Industry Index. Its holdings are equally weight-balanced and do not have to be S&P 500 components. So they can be smaller-cap stocks than those in XLE, and XOP is more diversified, with the top 10 holdings only comprising 35% of the assets, versus 77% for XLE.
Several of the XOP holdings are hitting new 52-week highs, including Cabot Oil & Gas (COG), Noble Energy (NBL), and Range Resources (RRC).
As far as recent dividend yield, they stack up this way: XLE 1.4% and XOP 0.8% versus 1.8% for SPY. Not a huge difference there, but how do they stack up performance wise?
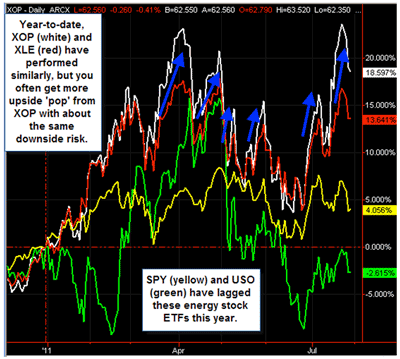
You can see on the first chart below that despite crude oil (and USO) being flat/down this year, there have been nice gains in both the XLE and XOP ETFs, as energy companies have been profitable.
But also note that when the group rises, XOP has tended to outperform XLE to the upside, with about the same downside risk. This has occurred despite XOP being more diversified than XLE (the smaller average market cap may have something to do with this), and this makes XOP more attractive for long side investors/traders, in my view.
NEXT: See 2011 Performance Chart for Top Energy ETFs
|pagebreak|Here’s a chart showing 2011 relative performance:
Key:
S&P 500 Index ETF (SPY) – Yellow
United States Oil Fund (USO) – Green
Select Sector SPDR - Energy (XLE) – Red
SPDR S&P Oil & Gas Exploration ETF (XOP) – White
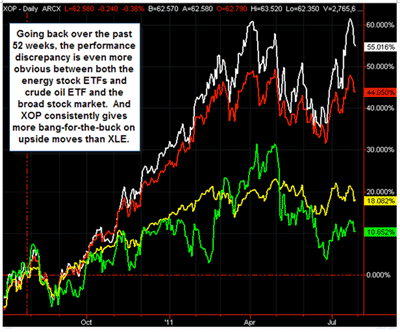
Stepping back to the past 52 weeks on the chart below, you can see that the recent outperformance by XOP and XLE isn't just a very short-term thing; it is actually even wider over the past year.
Again, note that XOP (in white) consistently makes bigger gains than XLE (in red). And while the crude oil commodity-based ETF USO is up over 10% in this time frame, the two energy stock ETFs have 4x and 5x greater performance, respectively.
Here’s a 52-week performance chart:
So based on my analysis, XOP is a more attractive play when looking for energy gains than either XLE or USO. But how does XOP look right now?
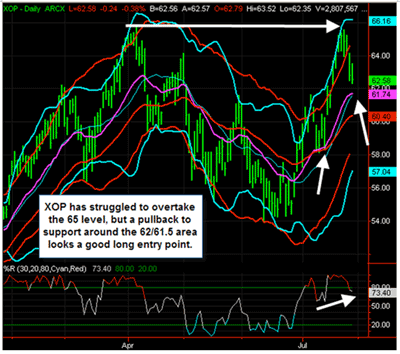
Zooming into the daily chart below, my take is that XOP started a new uptrend in late July and held around its middle bands and key exponential moving averages (EMAs) on the pullback during this uptrend.
Percent R (%R) is in strongly bullish territory and has been uptrending as well. So a pullback to the 61.50/62 area where these bands and moving averages (MAs) now lie looks like a very attractive long side entry point to me. The one caveat being potential overhead resistance around the 65 level, which is where the ETF reversed in early April.
The XOP daily chart:
Bottom Line
Those who are bullish about the energy sector or who want exposure to energy names, the XOP ETF is a good, efficient way to play a basket of stocks and has outperformed related securities like XLE and USO.
In the short term, the 62/61.5 area looks like a good long-side entry point on a pullback, and 65 would be the first logical short-term upside target.
By Moby Waller of BigTrends.com


