Troubles in the equity markets caused bonds to surpass key resistance levels, and a pair of bond ETFs offer traders ample opportunity to play this recent price spike.
Most stock traders don’t follow the bond markets, but they sometimes offer terrific opportunities. But you don’t have to trade bonds outright—the ETFs are a simple way to play the same markets.
You may not be aware of the large price breakout in defensive bond ETFs iShares Barclays 20+ Year Treasury Bond Fund (TLT) and iShares Barclays 7-10 Year Treasury Bond Fund (IEF), but it’s always worth reviewing along with current price levels to watch for support or a reversal signal.
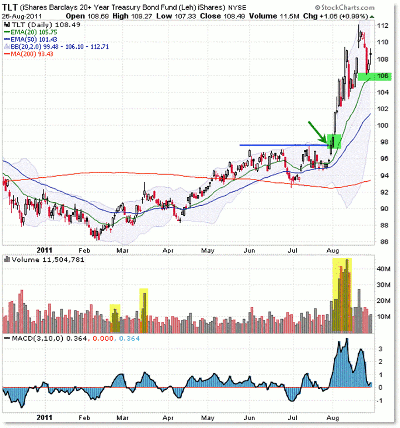
Let’s start with the daily chart of the popular TLT fund:
Investors and traders can turn to TLT when they want to take off some stock market risk or play for a bullish move in a traditionally defensive market. Short-term traders can of course use these ETFs like any other trading vehicles.
Price wise, TLT formed a clear overhead resistance level at $97 per share, which corresponded with the all-important 1,260 price support in the S&P 500.
When stocks sharply broke their critical support level, bonds subsequently broke their key resistance level, setting up a cross-market trading opportunity.
What resulted was a strong, impulsive move higher in bond prices (and bond ETFs) which took prices to levels not seen since the heart of the financial crisis of 2008.
The breakout was confirmed with surging volume, which took us to $112 on the TLT chart above.
From a chart standpoint, the most recent push into the $112 area was met with a negative volume and momentum divergence, which is a caution signal to late buyers of these funds. Typically, it’s not a good idea to get long into an overextended rally that’s forming negative divergences.
Still, the key daily chart level to watch is the rising 20-day exponential moving average (EMA) potential support at $106, which was this week’s low.
NEXT: Latest Charts and Trade Set-up for Bond ETF IEF
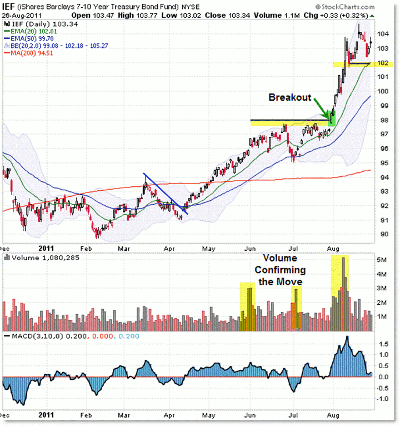
|pagebreak|Let’s now turn to the shorter-term IEF fund (which is similar to the ten-year Treasury note price) and then step inside the chart to the hourly vantage point:
The commentary/chart for IEF is very similar to that of TLT, so there are no major surprises.
Volume confirmed the move in an “accumulation” phase from March 2011 until present, where volume is failing to confirm the recent push to new highs into $104.
Like TLT, the 20-day EMA comes into play as a support level to watch at $102 in IEF. A failure to hold the 20-day EMA will be a short-term reversal signal.
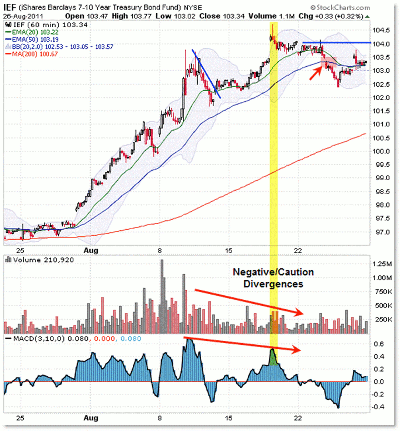
Speaking of short-term reversal signals, let’s step inside the hourly chart for additional insights:
You can pick up more information by looking at the hourly or 30-minute charts, especially in volatile markets like these.
We saw persistent confirmation in both momentum (3/10 oscillator) and volume all the way up during the first half of August, though the remaining half is showing clear negative divergences (non-confirmations) in both volume and momentum.
This week, we also observed a short-term (intraday) sell signal on the breakdown of rising trend lines and the rising 50-period EMA on the hourly frame.
That sets up a major caution signal (an early exit signal) and puts the focus squarely on the $102 level, which is our daily chart EMA support. A breakdown under $102 will likely be treated as a wider sell signal.
Otherwise, persistent trends have a stubborn tendency to overcome divergences, so these divergences/non-confirmations will be invalidated should buyers step back in and drive prices to new highs above $104.50 in IEF and $104.50 in TLT.
For now, keep focused on these respective levels in the context of an intraday deterioration of volume and momentum.
By Corey Rosenbloom, trader and blogger, AfraidToTrade.com


