By looking at these stocks’ relationships to their 200-day moving averages, you can formulate the right trading strategies to profit from their precarious positions.
With the recent sharp downturn in the stock market, we have a new list of most “overextended” and “underextended” stocks from their 200-day simple moving average (SMA). Some traders might call this a list of overbought and oversold stocks—meaning they have run beyond the course of a normal trend, and are due for a reversal back toward their 200-day SMA.
Let’s take a look at the current scan results of most extended S&P 500 stocks, starting with most overextended:
- Cabot Oil & Gas (COG): 49% above its 200-day SMA
- Motorola Mobility Holdings, Inc. (MMI): 40% above its 200-day SMA
- CF Industries Holdings, Inc. (CF): 31% above its 200-day SMA
- National Semiconductor Corp (NSM):27% above its 200-day SMA
- Range Resources Corp (RRC): 25% above its 200-day SMA
To recap briefly, the purpose of this scan is to identify potential trading opportunities depending on your individual style of trading.
There are two schools of thought on this type of list:
- Overextended stocks are overextended for a reason, and the expectation is that the recent strength—or weakness—will continue. Thus, this calls for trend-following/retracement style strategies in objectively strong/weak stocks.
- Overextended stocks have “gone too far” and will soon snap back to normal. Thus, these stocks may be ripe for “fade” or reversal strategies.
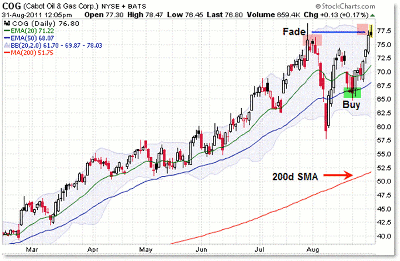
That being said, Cabot Oil and Gas (COG), which has shown up on prior similar scans—adding credence to the “trend following” strategies—is the most overextended stock in the S&P 500 from its rising 200-day SMA.
It’s also extended from its rising 20-day EMA and (currently) forming a reversal candle outside the upper Bollinger Band. That type of set-up favors short-term fade strategies that may create a buying opportunity on the pullback to its respective moving averages.
NEXT: Chart Analysis
|pagebreak|Let’s take a look to see what I mean:
There was a similar short-term fade/scalp opportunity into the July spike highs with little reversal candles, which preceded a sharp sell-off back to prior price levels.
The subsequent bounce set up a simple retracement pro-trend buy-in at the $65 level.
This is an example of how you can use this type of “overextended” scan list to play both strategies—pro-trend retracements and counter-trend fades—depending on your risk tolerance.
I highlighted the two stocks—MMI and NSM—that are overextended based on a gap. Large gaps tend to skew the results of this scan, and it’s preferable to play stable trends that don’t show such wide price gaps.
Otherwise, CF Industries (CF) and Range Resources (RRC) top the most over-extended list.
Do you see a pattern with the sectors? Basic materials stocks top the overextended list, which clues us in to broader sector/industry strength that you might want to explore on your own with similar charts.
With the bullish extensions above, what are the bearish under-extensions at the moment?
I went through and checked. None of these are showing significant gaps, and in fact all are showing relatively similar price trends on their daily charts.
With unemployment as high as it is, it’s perhaps no surprise that Monster Worldwide (MWW) tops the list, and is followed by two technology companies, Akamai (AKAM) and Juniper Networks (JNPR).
These companies—perhaps again unsurprising—have appeared on similar scans I’ve published on the blog.
Genworth Financial (GNW) and US Steel (X) round up the Top Five Most Underextended List, which encourage you to study the charts for potential opportunities depending on your style of trading strategy.
Scans are simple starting points for narrowing down the broad lists of stocks into manageable lists for trading set-ups and ideas―and this type of over extension scan is helpful in doing so.
Corey Rosenbloom is a trader and blogger at AfraidToTrade.com.


