The collapse of the retail sector has opened up good short and long opportunities in the market leaders on either side.
Browsing through the retail racks looks like the mess you see at the end of a 75% off sale the day before school starts. Carnage everywhere, but you force yourself to take a look because the prices are so low.
In the market version of this clearance sale, it seems it will take a long time to clean up and repair the store. This is true from the teen retailers to the department stores to women’s wear.
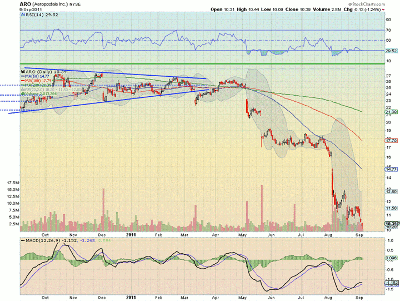
Look at the chart for Aeropostale (ARO), below:
After falling out of the symmetrical triangle in April and falling to the $18 area, it has since taken another nose dive lower to $12, where it consolidated briefly before moving lower again. It still has a moving average convergence divergence (MACD) indicator that is falling, and a relative strength index (RSI) that has fallen and can’t get up. These support more downside in the future.
Using $11 as a stop, you can short Aeropostale with a target of $4 to $5. It’s the worst of the teen retailers, but the charts for American Eagle Outfitters (AEO), Abercrombie & Fitch (ANF), Buckle, Inc. (BKE), and Zumiez (ZUMZ) are nothing to write home about.
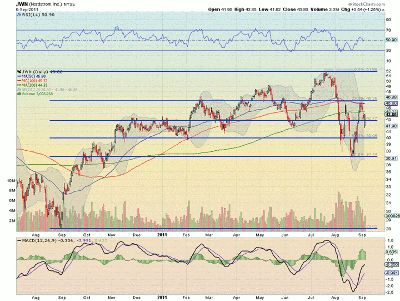
The big department stores are a little better, but also have some work to do. Look at Nordstrom (JWN), below:
It found support at the 61.8% Fibonacci retracement of the move higher from September 2010 to July 2011, and bounced back to the 23.6% Fibonacci level before falling back by 50% of the August move higher Tuesday, near $41.69.
To get excited about this stock, it would need to get over the $46.25 level, and then you could look for a move toward resistance at $49 and the previous high at $51.89. Until then, just watch. Dillards (DDS), Saks (SKS), and Macy’s (M) all have similar charts.
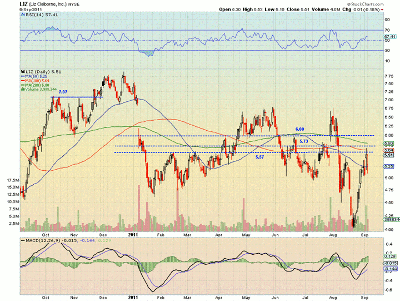
Finally, moving on to women’s wear, where you find an anomaly. Sure, there are crappy looking women’s clothing stocks like Talbots (TLB), but Liz Claiborne (LIZ) looks very different. After the two-step fall that began in early August, it has moved straight up, and is now testing the bottom of the resistance zone between $5.57 and $6:
As it arrives there, the RSI is sloping and trending higher, and the MACD is continuing to increase, both supporting more upside. The 16 cents to get through to resistance at the middle of the channel and then 43 cents to the top may not seem like much, but they represent moves of 2.9% and 7.7% respectively.
You could get long this stock on a move over $5.57, using $5.51 as a stop, for the move through the channel.
Greg Harmon can be found at Dragonfly Capital.


