Gold charts have flashed a confirmation signal on an important profit-taking event ahead, one that could really shake up bulls and bears alike but is best seen as a routine bull market correction.
It’s taken much longer than I originally expected, but we now have confirmation that gold’s D-wave decline has begun.
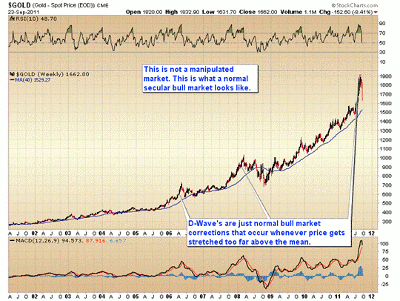
A “D-wave” decline is a normal, regression-to-the-mean, profit-taking event that occurs when gold gets too stretched above the mean. It is not a takedown by an anti-gold cartel.
Anyone with a modicum of common sense can look at the long-term chart of gold and tell that this is not a manipulated market. This is just a normal secular bull market and is acting exactly like a normal bull market acts.
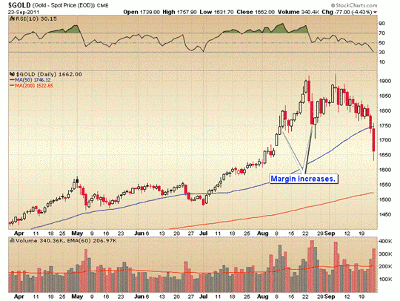
Furthermore, the conspiracy theories associated with gold are now bordering on the insane. I even heard the other day someone blame broker margin increases for the drop in gold. I guess they completely forgot that we’ve already had two margin increases in the last two months that had virtually no effect on gold.
Every bull market in history has its share of conmen and scam artists. Think Bernie Madoff, Enron, WorldCom, etc. The gold manipulation nonsense is just one of the many scams that are going to hitch a ride on this bull.
Actually it’s one of the oldest scams in the book. You find a bull market, make a one-way bet on rising prices, tout these "to-the-moon" prices to suck in subscribers lured by the reward of gigantic financial gains, and then blame an invisible cartel every time a correction occurs that you don’t foresee.
It’s a great way of not having to take responsibility when subscribers get caught in a normal corrective decline.
Needless to say, I don’t play those kinds of games. I try to get subscribers out ahead of intermediate declines. Yes, I’m usually a little early. I have the same problem with tops that every other human being in the world has: they are virtually impossible to call in real time.
Subscribers to the Gold Scents newsletter have sidestepped all of the D-Wave decline and instead have been 100% invested in the dollar index, which is the only asset initiating a strong trend higher.
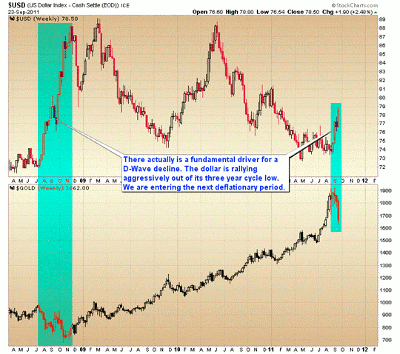
Actually, there is a fundamental reason for a D-wave decline besides just a normal regression-to-the-mean, profit-taking event: The dollar has now moved into the aggressive stage of the rally out of the three-year cycle low.
Article Continues on Page 2
|pagebreak|Deflation is starting to take hold in the world again. In deflationary conditions, defaulting debt collapses the money supply. There is a growing shortage of dollars in the world. That’s the reason why the dollar index is rocketing higher. As the value of the dollar rises during this deflation, it takes fewer dollars to buy an ounce of gold. You can see that this same process unfolded as the dollar rallied out of the 2008 three-year cycle low.
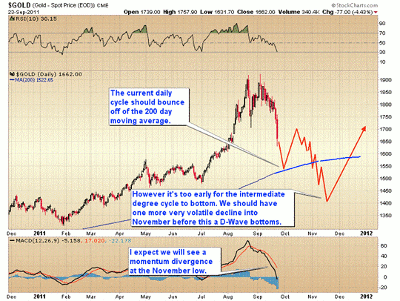
On a much shorter time scale, gold is now in the timing band for a daily cycle low. My best guess is that sometime over the next one to two weeks, gold will move down to tag the 200-day moving average. That will trigger short covering and a very convincing snapback rally.
However, it’s still too early for an intermediate degree bottom. There should be one more daily cycle down into November before the D-wave puts in its final bottom.
I suspect the next daily cycle is going to be a volatile nightmare that will chew up bulls and bears alike before a final plunge down below the 200-day moving average somewhere between $1300 and $1400.
As all D-wave declines have retraced at least 50%-60% of the previous C-wave advance, that would be a minimum target for the November bottom. At that point, we should see a very powerful A-wave advance triggered by the extreme oversold conditions generated at the D-wave bottom.
By Toby Connor of Gold Scents


