These stocks are already strong chart performers, and fundamentals indicate potential for increasing return on equity (ROE) in the future, a combination likely to produce continued share-price appreciation.
Looking for momentum ideas with solid sources of profitability? To create this list, we started with a universe of rallying stocks, and then identified which of them have encouraging DuPont equation profitability breakdowns.
Haven’t heard of these terms? No need to worry; here's an explanation of the key terms needed to understand this screen:
Rallying
When a stock is rallying, it means it is performing above its moving average for a given time period. It is presented as a percentage of performance relative to the average.
When a stock is performing above its 20-day moving average (MA), as well as its 50- and 200-day moving averages, it signals bullish momentum. All the stocks in this list are rallying above their 20-, 50-, and 200-day MAs.
The DuPont Equation
Return on equity (ROE) is a widely used profitability measure. In general, the higher the ROE, the more profitable the company appears. The problem with this is that profitability can come from many sources…some better than others.
In the 1920’s, the DuPont Corporation developed a useful equation that breaks down ROE into three components.
ROE = Net profit margin x asset efficiency x financial leverage
Net profit margin reflects cost structure, asset efficiency reflects productivity, and financial leverage is use of debt. Increases in any of the three can contribute to increased ROE.
In general, an encouraging DuPont breakdown implies one or more of the following:
- Improving net profit margin, i.e. rising net income/revenue
- Improving asset efficiency, i.e. rising sales/assets
- Decreasing financial leverage ratio, i.e. declining assets/equity
In other words, it is preferable for ROE to rise because of higher net-profit margins or asset efficiency. Increasing financial leverage, which would increase ROE, is not always a positive development for a company.
Now that you're familiar with the terms discussed, let's move on to the results of our screen. Use this list only as a starting point for your own analysis.
Article Continues on Page 2
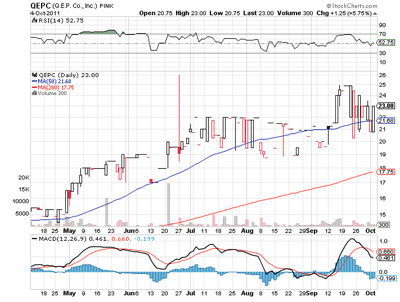
|pagebreak|QEP Co. Inc. (QEPC) distributes a range of hardwood flooring, flooring-installation tools, adhesives, and flooring-related products targeted for the professional installation and do-it-yourself markets.
The stock is currently trading 1.69% above its 20-period simple moving average (SMA20), 6.16% above its SMA50, and 30.34% above its SMA200.
Most recent quarter’s (MRQ) net profit margin is at 4.02% versus 3.28% year over year (y/y). Most recent quarter’s sales/assets are at 0.764 versus 0.7 year-over-year (y/y). MRQ assets/equity is at 2.067 versus 3.027 y/y.
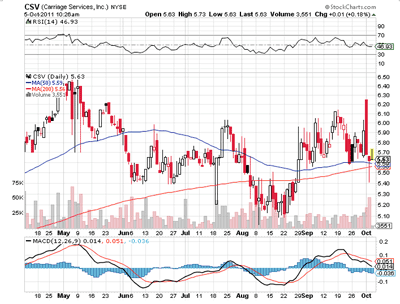
Carriage Services Inc. (CSV) provides death care services and merchandise in the United States. The stock is currently trading 1.35% above its SMA20, 5.21% above its SMA50, and 6.37% above its SMA200.
MRQ net profit margin is at 5.43% versus 5.17% y/y. MRQ sales/assets are at 0.071 versus 0.07 y/y. MRQ assets/equity come in at 5.367 versus 5.558 y/y.
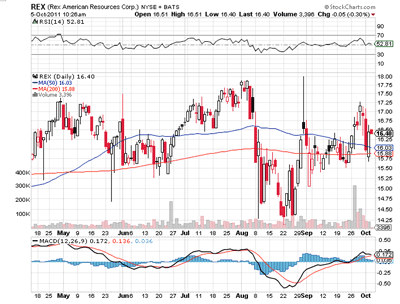
REX American Resources Corporation (REX) engages in the production and sale of ethanol and distillers grains. The stock is currently trading 3.45% above its SMA20, 3.37% above its SMA50, and 4.86% above its SMA200.
MRQ net profit margins are at 3.18% versus 1.89% y/y. MRQ sales/assets come in at 0.2 versus 0.149 y/y. MRQ assets/equity come in at 1.482 versus 1.745 y/y.
NEXT: 2 More Strong Performers with Room to Run
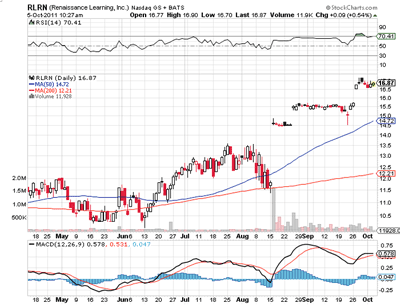
|pagebreak|Renaissance Learning Inc. (RLRN) provides computer-based assessment and periodic progress-monitoring technology for pre-kindergarten through senior high schools and districts in the United States and internationally.
The stock is currently trading 6.11% above its SMA20, 15.14% above its SMA50, and 38.29% above its SMA200.
MRQ net profit margin is at 14.87% versus 13.85% y/y. MRQ sales/assets are at 0.626 versus 0.359 y/y. MRQ assets/equity come in at -2.026 versus 6.065 y/y.
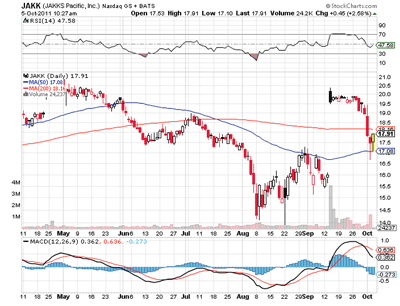
JAKKS Pacific, Inc. (JAKK) designs, produces, markets, and distributes toys and consumer products worldwide. The stock is currently trading 0.22% above its SMA20, 7.92% above its SMA50, and 1.38% above its SMA200.
MRQ net profit margins come in at 3.21% versus 2.42% y/y. MRQ sales/assets are at 0.215 versus 0.205 y/y. MRQ assets/equity comes in at 1.528 versus 1.619 y/y.
By the Staff at Kapitall.com


