Select US Treasury ETFs are moving following the announcement of the Fed’s “Operation Twist.” Here are key support and resistance levels for each, as well as other factors for traders to consider.
Since "Operation Twist" has been in the public thought process, many bond market participants played the anticipated flattening of the yield curve by buying long bonds and selling shorter maturities. Other market participants bought the iPath US Treasury Flattener ETN (FLAT). There may be good fundamental reasons for doing this, but the technical picture is mixed.
Could it be because Operation Twist is already priced in? I bet the Federal Reserve would not be happy about that. Maybe it is because FLAT only measures the flattening between the two-year and ten-year Treasuries, both of which the are a big piece of the Fed’s current inventory. What I know is that it looks ready for a 4% move. Let’s take a look:
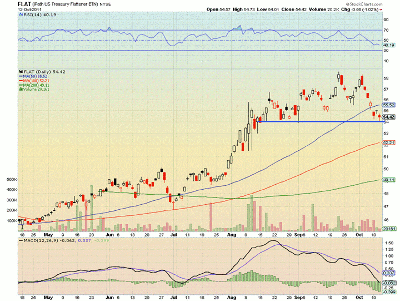
The iPath US Treasury Flattener ETN (FLAT) has fallen back and is testing previous support at $54. If it were to break through lower, then the next levels of support are at $52.20 followed by $51.40 and $50.
The Relative Strength Index (RSI) is teetering on bearish territory and the Moving Average Convergence Divergence (MACD) indicator is growing more negative, both supporting more downside.
If, however, it does hold support at $54, then there is resistance higher at $55 followed by $56, $57, and then the previous high at $58.65.
Where there is no guarantee that it will do either or run to the extremes, it seems likely a two-point move in either direction, or 4% roughly, is in the cards.
Perhaps this uncertainty on direction comes from the fact that the two pieces are both moving lower and the direction of FLAT is really determined by which one is moving faster.
NEXT: 2 More Treasury ETFs in Play Now
|pagebreak|Two ETFs, the iShares Barclays 7-10 Year Treasury Bond Fund (IEF), and the iShares Barclays 1-3 Year Treasury Bond Fund (SHY), can be used to illustrate.
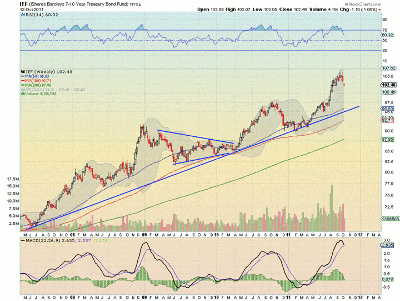
First, a chart of IEF:
The iShares Barclays 7-10 Year Treasury Bond Fund (IEF) showed topping candles the last three weeks which are being confirmed with a move lower this week. The RSI is heading sharply lower and the MACD has just crossed negative, both supporting more downside. Should this confirmation hold, the next support level lower is at $97.50 followed by the rising trend line support at $95.
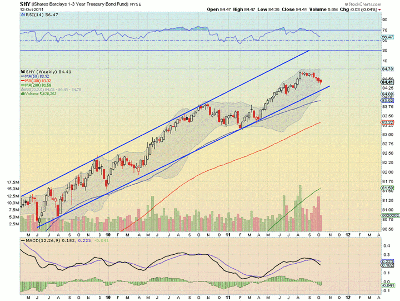
Now let’s look at SHY:
The iShares Barclays 1-3 Year Treasury Bond Fund (SHY) has been moving lower toward the uptrend line support at $84.25 since the RSI peaked in early August. Recently, the MACD crossed lower as well. Below the trend line, there is support at $84.12 and then $83.80.
Which one moves down faster will determine which way FLAT breaks. But who knows which it will be. But with both looking lower, why not trade the pieces instead?
By Greg Harmon of Dragonfly Capital


