The latest charts for copper and a popular tracking ETN clearly show the important support and resistance levels to watch, allowing traders to anticipate upcoming price action and plan their actions accordingly.
We’ve been seeing copper in the news lately, mainly due to its recent breakdown and consolidation off a key support level.
Let’s take a look at the weekly time frame and then drill down to daily chart levels to watch in both physical copper and the iPath DJ Copper Subindex Total Return ETN (JJC).
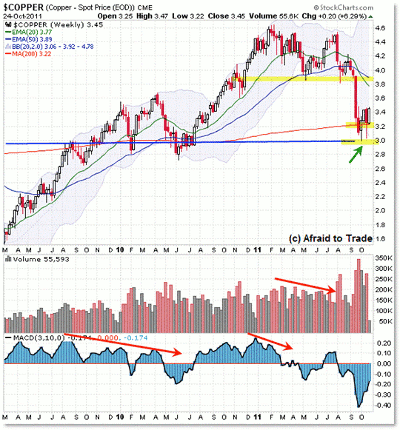
First, the weekly chart of copper:
A quick glance at the current chart shows the simple $3.00 level as a longer-term key level. It’s not magical; it’s just a round-number level where price has reversed in the past, including September and October 2011.
In addition to a pure price level, the 200-week simple moving average (SMA) resides at $3.22, which is a level to watch in conjunction with $3.00.
The other quick thing to note on the weekly chart is the bearish cross of the 20/50 exponential moving averages (EMAs), which cluster about the $3.80 level. That happens to be another key price level to watch, as price has bounced three times from the $3.80 support (it may prove to be resistance in the future).
NEXT: Copper Daily Chart, Key Levels to Watch in JJC
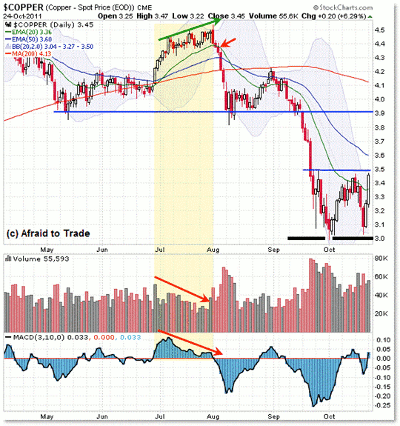
|pagebreak|With the weekly chart structure above, let’s now drop to the daily chart to see the current levels to watch:
The daily chart gives us a bit more clarity about the key simple price levels to watch: it’s $3.00 for confluence support and the $3.90 area for upper resistance.
The immediate level for traders—especially those looking for a confirmation breakout trade to the upside—is the loose cluster from $3.50 (prior price swing highs along with the upper Bollinger band) to $3.60 (the falling 50-day EMA).
See related: Daytrading with Bollinger Bands
A firm power breakout above these resistance levels will likely be seen as a buy signal, along with a “cover-all-shorts” signal.
The key levels to watch immediately are the confluence overhead resistance at $3.50 to $3.60 (which, if broken, targets $3.90) and the long-term critical support at $3.00.
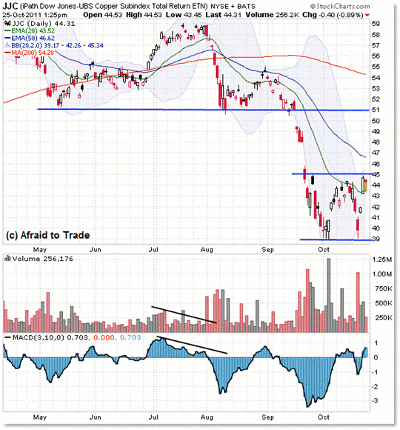
Here are the corresponding price levels for copper ETN JJC:
A quick checkup shows us a similar structure. Immediate resistance exists at $45 (price and upper Bollinger band) and $46.50 (falling 50-day EMA).
Above the $45/$46 resistance is the upper key target at the $51 level (a potential target to play for on a closing breakout above the $45 then $46.50 level) and beneath the current range resistance is the critical support at $39.00 per share (double bottom).
Keep watching these levels along with any follow through on any breakout that occurs; otherwise, without a breakthrough here, it would suggest the lower support may be re-tested.
See related: Trading Retests Safely and Profitably
By Corey Rosenbloom, CTA, trader and blogger, AfraidToTrade.com


