Using Fibonacci goes beyond drawing retracement and extension lines. Price Headley of BigTrends.com explains other ways to use the popular and reliable indicator.
You may have heard the terms "Fibonacci" and "Fibonacci numbers," but what do they mean and how are they incorporated into trading indicators? First things first, what (or more specifically, who) is Fibonacci?
Leonardo Pisano (a.k.a. Fibonacci) was a 12th-century, Italian mathematician that developed a sequence of numbers where each successive number is the sum of the two previous numbers. The Fibonacci sequence is as follows:
1, 1, 2, 3, 5, 8, 13, 21, 34, 55, 89, 144, 233.
Something interesting about these numbers, they are all roughly 1.618 times the next number. Fibonacci's discovery has come to be known as the "Golden Ratio." The Golden Ratio becomes three different percentages when applying Fibonacci's findings to technical analysis: 38.2%, 50%, and 61.8% (note that other multiples can be used).
While all of this information is interesting, what does it have to do with technical analysis and trading?
You will see Fibonacci numbers represented in four main ways in technical analysis and trading: retracements, arcs, fans, and time zones. Let's deal with these in order.
Fibonacci Retracements
Take a chart of your stock, then draw five lines. The lines fall at 100% (the chart's high), 61.8%, 50%, 38.2%, and 0% (the chart's low).
Continued analysis has found that these levels will often act as support or resistance for a stock (depending on its situation compared to the stock).
NEXT: Trading Using Fibonacci Arcs
|pagebreak|Fibonacci Arcs
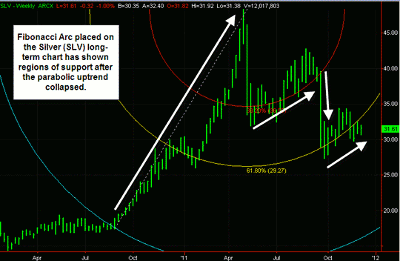
To create Fibonacci arcs, draw a trend line from a stock's extreme high to its extreme low on a given chart. Then, using one of the extremes as a center point, draw three arcs positioned at the 38.2%, 50%, and 61.8% levels.
If you draw these arcs using the high point as the center, you should find levels of support at the Fibonacci arcs. Using the lower point as the center should help identify potential resistance levels. The iShares Silver Trust (SLV) weekly chart below is an example of Fibonacci arcs showing support areas.
Fibonacci Fans
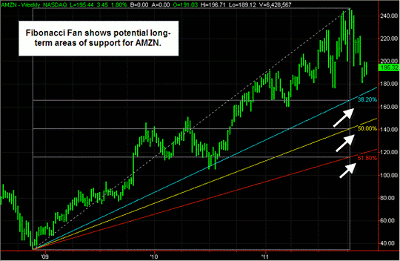
Again, we need to draw a trend line from the low point to the high point on a stock's chart. To draw the fan lines, use the leftmost point of the trend line and draw three lines from this point. These three lines will reach points that divide the vertical distance between the trend line points at the key Fibonacci ratios (38.2%, 50%, and 61.8%).
Technical analysts believe that these fan lines can act as support or resistance. Fibonacci fans on the Amazon.com (AMZN) long-term chart below can show potential areas of support should the uptrend break down.
NEXT: Trading with Fibonacci Time Zones
|pagebreak|Fibonacci Time Zones
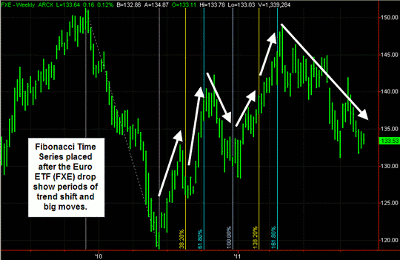
These indicators are often referred to as the Fibonacci time series. The zones are found by dividing a chart with vertical lines, which fall on the Fibonacci sequence (as shown earlier). These zones are then examined to see where significant price movement takes place.
Fibonacci time series placed on the CurrencyShares Euro Trust (FXE) long-term chart below can show areas where a trend acceleration or reversal is likely to occur.
In summary, Fibonacci numbers are more than a simple ratio or sequence of numbers when it comes to trading stocks. They can be utilized as various indicators that may point to key support, resistance, and reversal areas.
You can see that with "big-picture" long-term charts and especially after big moves, Fibonacci indicators can help point to key levels.
Fibonacci numbers and sequences are found in nature and are used in a variety of scientific, mathematic, and other formulas. Having been created in the 12th century, they certainly have stood the test of time.
By Price Headley of BigTrends.com


