

Shares of Computer Sciences Corp. (CSC) have been pounded in 2011, but chart and volume patterns show bullish potential, and the shares could take part in any year-end rally by the broad markets.
Down by more than 60% since early 2011, shares of Computer Sciences Corp. (CSC) have really had the stuffing kicked out of them. The earnings growth estimates for the stock aren't looking all that pretty as of late, and traders and investors have yet to show much interest in helping the stock recover some of its former glory.
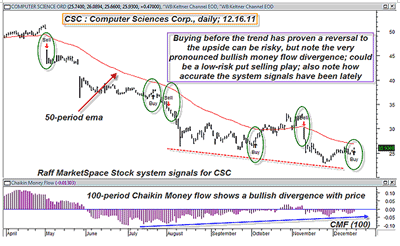
If a downtrend can be officially defined as a series of lower swing highs and lower swing lows, then that appears to be exactly what is displayed on the below chart for CSC (Figure 1).
Click to Enlarge
Another bearish sign is that the stock has remained below its 50-period exponential moving average (EMA) for most of the year, only managing to peak above it for a brief time on two separate occasions.
Also note the accuracy of the Raff MarketSpace Stock System short signals (green ovals on chart); every short signal has been a nice winner, although one long signal also made a bit of coin for traders in this stock, too.
So anyone looking to trade this new Raff buy signal might do so with some hesitation, but only if they failed to take in the big picture presented to us by the chart. I am referring, of course, to the very pronounced and decidedly bullish Chaikin money flow divergence with the price action on CSC's chart.
The CMF(100) histogram has been making a series of higher lows since mid-July 2011, even as CSC has continued to trend lower. This kind of money flow/price action is very typical as a stock seeks to make an enduring low before reversing course and rising in price again…for a while, at least.
One thing to keep an eye on is the strength of any move back up toward the 50-period EMA, and also whether the stock wants to make a retest of its November 25 low of $22.80 (and if such a retest is successful).
With the broad market indexes all trading close to their respective 21- and 50-day EMAs, it's anyone's guess as to whether the next strong move by the .SPX, .RUT, or .NDX will be bullish, bearish, or something in between. If you see all three indexes beginning to catch a bid before New Years, then it's very likely that CSC may want to go along for the ride, too.
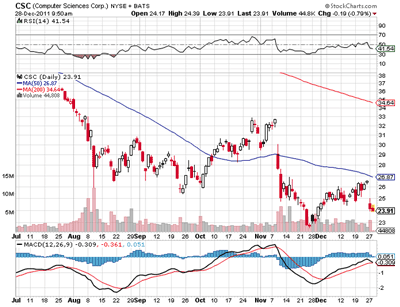
Here is a daily chart from December 16. The most recent buy signal would have been punishing since the stock has dropped back down.
However, now that it has come down a bit, it might be time to take a closer look:
Click to Enlarge
If the overall market remains weak, one possible way to trade CSC is to sell a modestly out-of-the-money, near-term put option. You really need to watch this kind of a position like a hawk, just in case the market stumbles and tries to "put" your put in the money.
Waiting for a successful retest of the recent swing low is probably a wise way to begin to engage such a position, as you want to make sure there is a support level that the market respects before trading in such a fashion.
The other way is to put on a straight stock position that risks no more than 1% of your account size, getting long on a rise above the recent high of $26.09 and then following up the position with a two- to three-bar trailing stop of the daily lows. This is actually less risky than selling a naked put, and for most trades, it's probably the safer route to go.
As December winds down, make sure your portfolio is protected no matter what the broad markets may choose to do between now and January 2. This may mean lightening up your holdings and building a reserve of cash to be deployed once the market truly tips its hand, or it might mean just buying some low-cost insurance in the form of put options to protect against another euro-inspired selloff like we witnessed in July and August 2011.
Take a few defensive measures now and enjoy the year-end holiday season that much more.
By Don Pendergast, founder, Linear Trading Systems, LLC


