This intraday set-up relies on indicators like the NYSE TICK and TRIN for helpful signals but can be effectively used to draw quick profits from fast-moving stocks, as this recent example shows.
The end of the year frequently brings me trade ideas in the retail sector. I recently had one that was a substantially bullish case for Ross Stores, Inc. (ROST).
I decided to use what I call a "smash ’n grab" scalp idea. Instead of using my normal 1% price target, I used a simple 0.5% price target and a 0.5% initial stop.
Here is the thinking that went into this trade, one that finished profitably during a Friday morning session. Seeing how this trade went down will hopefully give you additional ideas on other stocks that meet similar criteria.
To begin, see Figure 1 below.
ROST’s daily close on this particular Thursday was $50.42 and the stock opened on Friday at $50.43, below Thursday’s high of $50.60, which was the item of most interest in this trade. Since the stock hadn’t gapped higher above the previous day’s high, it was still a good candidate to set up a buy-stop market order at $50.62 with a sell-stop market order at $50.38 (0.5% below the anticipated fill price) and a sell limit order at $50.89 (0.5% above the anticipated fill price).
I sent all of these in as a “one sends the other,” or OSO order in TradeStation; if the buy-stop at $50.62 was filled, then the other two orders would also be sent at the same time.
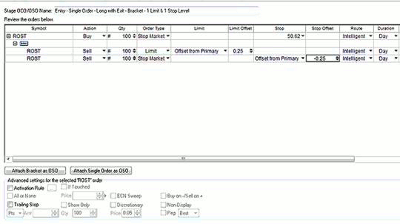
Sending in multiple orders is very easy when using the “one cancels the other” or “one sends the other” (OCO/OSO) screen in TradeStation. Here, a buy-stop market order—once filled—becomes the trigger to send in a pre-configured sell-stop market and sell limit order.
The screenshot shows how I set the order up. It’s a simple and straightforward process that only took a moment to configure. First, I clicked the OCO/OSO button on the TradeStation tool bar, then "Entry-Single Order-Long," then "With Exit-Bracket-1 Limit & 1 Stop Level."
Once the OSO configuration screen appeared, I simply entered my buy-stop price of $50.62 along with the offset amounts (in this case, 0.5% was the equivalent of $0.25) from the buy-stop order price and then sent the order in.
NEXT: See How This Trade Played Out
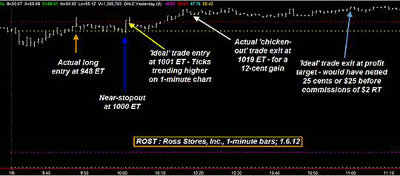
|pagebreak|The long trade for 100 shares was filled at 9:48 Eastern time and did come close to being stopped out at 10:00 ET when ROST dipped down to $50.39, a mere penny above my stop loss. But then the stock rebounded sharply and by 10:18 ET, it was at the lofty price level of $50.86, only three cents from my target of $50.89 (see Figure 2 below).
So here I was holding a profitable position and in a minor quandary: would taking the profit now be wise, especially with the NYSE TRIN and TICK readings not in an especially bullish mode? Or should I move my stop up a little above break even to at least make a couple of bucks no matter what happened?
See related: TRIN: Prime Breadth, Depth Indicator
I didn’t want the thrill of victory to morph into the agony of defeat, so I settled on a compromise by raising the stop loss to $50.64 and then up to $50.75, with the final trade result being a stop-out at $50.75 at 10:19 ET.
In retrospect, including a 25-cent trailing stop at the time of the OSO order set-up would have made the exit process less stressful (and ultimately, more profitable). Using the $0.25 trail would have kept me in the trade until the $50.89 target was hit at about 11:00 ET.
Here is a one-minute chart:
So in this case, the trade was successful, but not as profitable as if I had included a more comprehensive exit strategy at the time all of the orders were sent in. That was lesson 1.
The other big point of understanding for me was the critical importance of timing a breakout trade (bullish or bearish) only when the NYSE TICK and TRIN are in support of the desired direction of the trade set-up.
See related: How to Use the NYSE TICK Indicator
At 9:48 ET, the TICK was trending lower (one-minute chart basis) and actually closed at -270, hardly an ideal situation for a bullish breakout in ROST. Meanwhile, the TRIN was trending progressively higher (bearish trend), closing at 1.15 at 9:48 ET.
By having kept closer watch on the trend on a one-minute chart, the ideal breakout trade entry of 10:01 ET would have kept traders out of the actual trade at 9:48 ET, one that ignored the trend of the TICK/TRIN and therefore endured a lot more heat due to the weak market conditions at the time of entry.
Had I waited for ROST’s second bullish breakout attempt at 10:01 ET, I would have endured a lot less heat on the trade, as the trailing/initial stop would have done its job with little threat of early stop-out— unlike the earlier, actual entry.
Part of the reason was that the TICK was now trending higher, although still not bullish (the reading at 1001 was -107). The uptrend momentum of the TICK was a good indicator that the broad market (including, hopefully, ROST) might continue higher.
The TRIN was actually a bit more bearish now, having risen to 1.27, but the trend had flattened out, offering more of a pleasant market environment for a long entry.
In any case, the big idea is to always be aware of the intraday trend of the TICK/TRIN duo and not just their actual readings. No matter what kind of intraday trading you favor, always check out the TICK/TRIN trend based on the same time frame as the stock or futures contract you are trading. It can and will pay big dividends over time and will help you make—and keep—more of your hard-won profits.
By Don Pendergast, founder, Linear Trading Systems


