Moby Waller of BigTrends.com explains an indicator that just fired a buy signal and has been profitable in 71% of the previous trades in his scan.
The S&P 500 Index (SPX) (SPY) has been in a consistent uptrend recently. This has led the SPX Williams Percent R (%R) reading, using Price Headley's 30 daily input setting, to reach a level of 99.93 as of Wednesday's close (Jan. 18).
The scale of %R is 0 to 100 and we generally consider a reading above 80 to be bullish and below 20 bearish. However, it is fairly rare to get such an extreme reading, so I went back to test the data.
With a level above 99, %R would seem obviously likely to head back lower, but does the market pull back or continue to accelerate?
Well, I looked back at SPX data from the present going back to the year 2000 because there have been multiple types of markets in this time frame and also it's a good round number from which to judge things.
Interestingly, SPX itself is actually down since 2000 (not including dividends). It opened the new millennium at 1469.25 and closed at 1308.04 Wednesday (around a 11% loss). This is one of the reasons why we constantly mention that "buy and hold" hasn't worked in this environment; you must be more active in asset allocation and trading.
So, what has SPX done after %R closes above 99? I optimized a simple "Buy SPX after >99%R" test in TradeStation for a holding period of 1 to 20 trading days, and the top result came up as 16 days (a bit over three weeks). The results were somewhat shockingly bullish to me, as I didn't expect them to be so strong.
There are no concurrent signals or any other filters or exits built into the test, but a new signal can start as soon as a previous one expires, assuming the last holding day had a %R reading over 99.
With 42 signals over the 2000-2012 time frame, there have been a bit under four per year. In 30 of these cases (71.4%), the market was higher 16 trading days later (actually, 17 days total because this is a "buy the open, sell the close" signal).
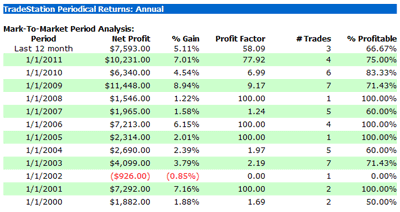
The significant thing to me is the consistency of the returns over this time frame. Throughout bull, bear, and flat markets, this indicator has worked well. There was only one losing year (2002, with only one signal that was a loss) and one 50/50 year (2000). The rest all had more winning than losing signals.
Take a look at the results grouped by calendar year:
In addition to the 71% win rate, the average winning trade was also 1.5x the average losing trade, giving this a very healthy profit factor. Certainly, 42 isn't a huge sample size, but as we mentioned, this covers a long time frame with many types of markets.
See related: A Critical Stat Most Traders Overlook
|pagebreak|There were 15 winning trades where the market rallied over 2% after such a reading and only one losing trade where the market lost over 2% (a 5.1% loss in 2007). So only one of 42 occurrences proved to be a big market loss; that's the kind of edge you want in your pocket.
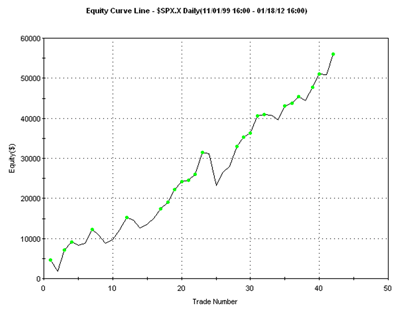
Plus, take a look at the equity curve of these signals below. It's consistently higher since 2000, and think of that in comparison the SPX trend line since 2000, which is down 11%:
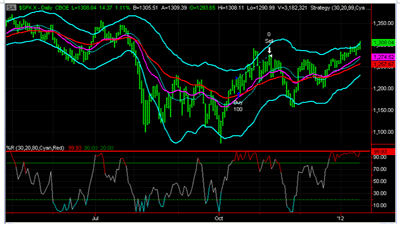
Let's take a look at the current market and the most recent signal on the chart below. The reading in October 2011 was the first since February 2011 and was certainly a nice one: SPX rallied from 1224.47 to 1275.92, a gain of 51.45 SPX points, or 4.2%.
Thursday morning fired a new buy signal from this indicator. A 2% rally from here would take SPX to 1334, and a 4% push would reach SPX 1360. (By the way, SPX 1361 is also a key long-term weekly Fibonacci level.)
Here's the SPX daily chart:
Bottom line to me is that based on past data, we're looking at over a 70% chance of a higher market 17 trading days from now (into the second week of February). At the least, a market plunge over 2% in that cumulative time frame seems very unlikely from the data. So don't be scared of very strong %R and other "overbought" readings; as we often say, "The trend is your friend."
By Moby Waller, contributor, BigTrends.com


