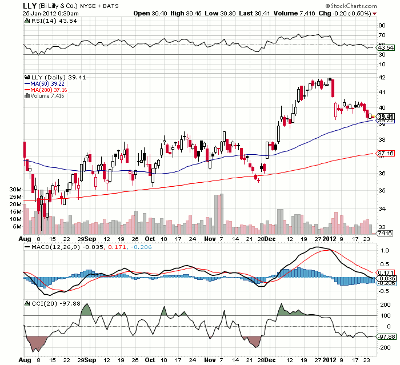
An early-year decline has taken shares of drug maker Eli Lilly & Co. (LLY) to strong moving average support, potentially in advance of a new run to higher prices. If support holds, here’s how to play it.
It’s been a tough start in 2012 for Eli Lilly & Co (LLY). The drug maker enjoyed a nice holiday season in December after slowly rising through the summer and testing its 200-day moving average (MA) multiple times.
LLY now sits carefully at its 50-day moving average, which appears to be holding as support. The MACD appears that it may just ever-so-slightly be starting to flatten, and the CCI indicator has been bouncing off the lower line, confused, it seems, about which direction to go confidently.
Learn more: Demystifying the MACD Indicator
Should the 50-day moving average hold as support, I would look for LLY to make a move toward the previous high in the area of $42. A stop just below the 50-day moving average ($38.90 for conservative traders and $38 for more aggressive traders) would be warranted.
By Tim Bourquin, co-founder, The Traders Expo
Tim will be moderating several panel discussions at February’s New York Traders Expo.


