A time-tested indicator has spotted a high-momentum breakout play on Waters Corp. (WAT) that offers clear risk parameters for both conservative and more aggressive traders.
The “Deel New Highs” indicator screen (available in MetaStock) is an "old reliable" when it comes to finding super-high momentum stocks and fresh, significant breakout plays. The latter type of set-up is what’s featured here in this chart of Waters Corp. (WAT).
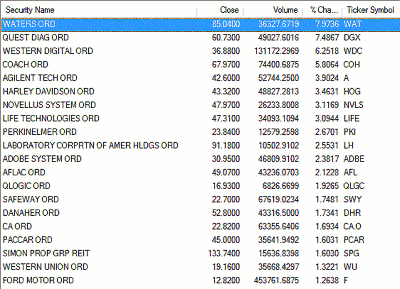
It was first triggered last week when it popped up in the top 20 new highs among S&P 500 component stocks.
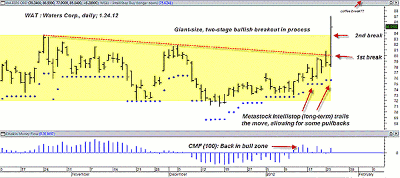
Waters shares have broken higher from a very well-mannered, long-running consolidation pattern (one that began on August 9, 2011, in the wake of the summer selloff) and have apparently done so with style.
Just look at the beautiful two-stage breakout: the resistance line connecting the September, October, and December (all from 2011) swing highs was violated first, followed not long after by the horizontal resistance line coming off the same September 2011 swing high.
The stock jumped more than 7.9% on Tuesday in the process of doing so, and it has no doubt jumped on to the watch list of many a starry-eyed momentum player in the market.
Long-term money flow is still hanging above its zero line (based on the Chaikin money flow 100-period histogram (CMF)(100)), which offers some hope to the bulls that the stock may just decide to continue on its merry way north for the near term.
Here is a chart from the day the stock broke out on huge percentage change (% change) volume.
I’ve plotted the MetaStock “Intellistop” (long-term version) on the chart above, as it gives traders with a longer-than-swing-trade mentality an idea of where a logical trailing stop might go, particularly if trading a covered-call set-up in WAT.
See related: 3 Ways to Profit Using Covered Calls
These trailing stops are standard in MetaStock 11 (and other trading platforms) and come in both short-term and long-term varieties that can easily be plotted for long and short trade set-ups.
NEXT: Trade Plans for Aggressive and Conservative Traders
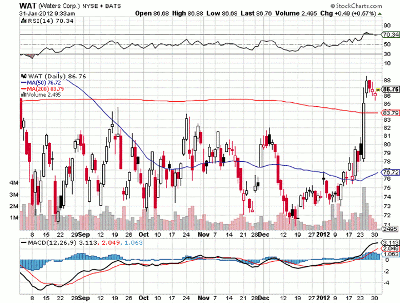
|pagebreak|Currently, the stop value is at $75.62, nearly $10 below Tuesday’s close of $85.04, meaning that traders considering putting on a stock-only position here need to use modest trade sizing if they wish to keep their risks small.
Here is a current daily chart:
For example, if you have a $50,000 equities account and want to risk no more than 1% (or $500) of your account value on this trade (assuming an entry at $85.04), your risk per share is $9.42. So if you divide $500 by $9.42, you end up with 53 shares as the maximum position you can put on (assuming you are not using margin, and if you are, then shame on you for trading such a potentially risky long entry with that added element of risk) at a 1% risk factor.
Playing WAT might involve waiting for a modest intraday pullback over the next few sessions (big breakouts like this often invite near-term profit taking) before going long and then holding on for as long as a 60-minute trend line of any subsequent up move manages to stay inviolate.
More conservative traders could just do the boring old covered-call routine, using near-term options that have lots of fast time decay (Theta) working for them.
See related: Understanding Theta and Time Decay
Since bid/ask spreads are of prime importance to successful option traders, make sure you know how to work a bid to get as much premium as you can for the call(s) you decide to sell on this particular buy/write set-up. The pennies saved will add up to dollars over the course of a successful trading career.
By Don Pendergast, independent trader and systems developer


