A strong buy signal from a volume-based trading system suggests that shares of Novellus Systems (NVLS) may continue their upside move, possibly surpassing the $50 price level in the very near term.
Having tried to call numerous tops in various stocks and futures markets over the years, I’ve learned the hard way that such activities are nothing more than a form of gambling, and as such, they generally lead to losses and frustration. Having matured significantly as a trader since those days, I now know that the market—any market and any time frame—can do just about anything at any time, no matter how wonderful I may believe my charting or systems building skills to be.
As I’ve grown more and more certain about this truth (it’s still true whether I believe it), I have also become less fearful of taking positions in stocks that have already experienced significant bullish moves as long as I have a rock-solid game plan on when to enter and exit such a trade.
Having analyzed thousands and thousands of charts since 1979, it doesn’t take too long to start seeing repetitive patterns in stocks, ETFs, and futures markets, and many of those patterns have similar cause and effect dynamics underlying them. So with that said, let’s apply a lesson or two from those observations to the current daily chart set-up in Novellus Systems (NVLS).
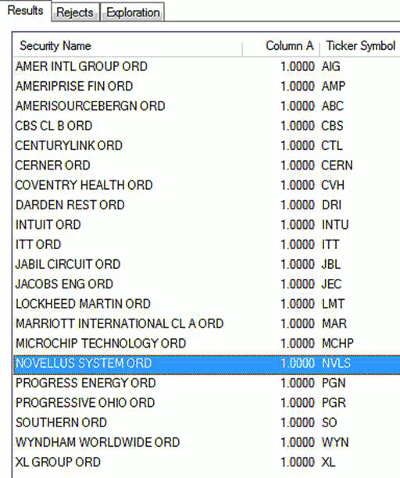
A MetaStock scan for “Rahul Mohindar Oscillator” (RMO) buy signals produced this list of candidates a few days ago:
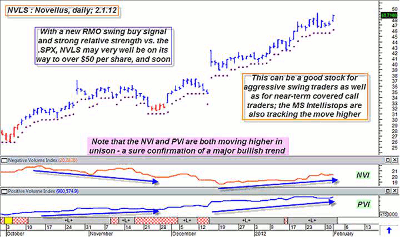
After NVLS bottomed out in early-October 2011 at $25.95, it didn’t take too long for the CS Scientific Hybrid Trade screen (an expert advisor in MetaStock 11) to start coloring the price bars to blue (just three sessions after the October 4, 2011 low), as the stock began to recoup a portion of last summer’s losses.
Plotting the MetaStock MS11 “Intellistop” (long-term buy) trailing stop function on the chart provided a way to know when it was time to exit this hypothetical position. If you recall, in a recent article, I described a dirt-simple trading system that uses the red/blue bar color changes along with MS11 long-term buy trailing stops to create a complete trading system (for MetaStock users) for the long side of the market.
Well, this is the same system, applied to NVLS. Note the first run higher from the low was reasonably strong, but it began to stall and falter during November, finally stopping out on a close beneath the prior day’s stop on November 22, 2011 at a price of $32.29.
In the lower portion of the chart, you’ll note that both the negative volume index (NVI) and positive volume index (PVI) were confirming the weak November performance of the stock. The PVI was in a steady bullish trend, but the NVI was already starting to drift lower, a sure sign of non-confirmation that showed a lack of bullish conviction among traders and investors.
This trade made 10.12% before slippage and commissions during its six-week run; not bad at all.
|pagebreak|When the PVI and NVI are trending in the same direction, it will almost always confirm the existence of an extremely strong market move, whether bullish or bearish. In this example, both of these useful volume-derived indicators suggest that NVLS’ uptrend may be likely to continue.
An effective trading system does not need to be expensive to build (if you already own or lease MetaStock, it’s essentially free) nor hard to understand in order to obtain potentially profitable outcomes in your favorite stocks or futures markets.
The next hypothetical long entry came on December 1, 2011, at $34.61, and as of this writing, the trade was still open and NVLS was trading just under $48 (up by more than 42% in just two months). The trailing stop is currently at $46.10, so even if NVLS soon drops below the stop, a sizable profit is likely to be retained.
Never underestimate the power of a trending market, nor try to predict market tops. Just follow the trend with a fixed, objective approach toward cutting losses and letting profits run.
By the way, look at how well the PVI and NVI (I refer to them as the "dynamic duo" among volume-based indicators) are following the move higher. Both trend higher together, meaning that the stock is tending to rise on low-volume as well as high-volume days, a very bullish sign indeed.
At the close on Wednesday, February 1, 2012, the (RMO) system fired a swing buy signal for NVLS, yet another confirmation of strength in this unfolding trend move. The top pickers will probably say that NVLS has just gone too far, too fast, but wise traders will probably want to stay with the trend and simply use this new signal to start a covered-call trade or even put on a modest add-on position using the same long-term volatility trailing stop shown on the chart until the move ultimately peters out.
Learn to trust the trading signals from systems that have a good track record and you’ll spend a lot less time worrying about your positions in the market.
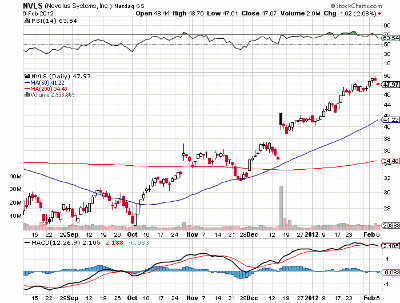
Shares of Novellus have risen nearly 88% since October 4, 2011, and with a new long buy signal waiting to be triggered, the stock may see $50 sooner rather than later.
By Don Pendergast, independent trader


