

A remarkable price and volume spike in shares of Cerner Corp. (CERN) is likely to give rise to further gains, and traders who consult the short-term charts will have little trouble finding suitable entry points.
Of all the dozens of explorations available in most trading platforms today, few are more powerful that the price and volume breakout scans. One that I use in MetaStock is a scan for stocks that have jumped at least 5% in one session—and with a daily volume amount that is at least 50% above its 50-day average volume reading.
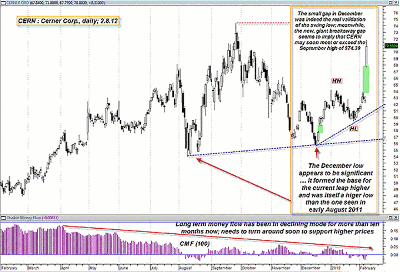
After the close of trading last Wednesday (Feb. 8), Cerner Corp. (CERN) easily met those criteria; the stock was up by 13.28% on Wednesday on volume that was 241% above its 50-day average value. Now that’s a breakout of major interest, for sure.
Here’s a look at CERN’s fascinating daily chart on that day:
Click to Enlarge
There is so much to comment on with this chart for CERN that to detail it all would take at least four pages, but let’s just focus on the most important features.
Note the left portion of the chart and how the long-term money flow (based on the Chaikin money flow (CMF)(100) histogram) was steadily deteriorating even as CERN continued to power higher into late July 2011; then came the Eurozone’s crash trigger that caused such a nasty wipeout in CERN’s valuation.
This makes a good case for the assertion that the market (this stock and thousands more) was already destined to have a major correction due to the declining money flow histogram—and that the European crisis was simply the precipitating trigger that got the selloff actually going—and if it hadn’t have been the euro mess that triggered it, it would have certainly been something else.
The next thing to note is the linkage between all of the technical events leading up to Wednesday’s massive gap up in this stock. First note that the December 2011 swing low was higher than the all-important August 2001 swing low, and that after the stock began to turn higher, the market gapped up as if to affirm that the December low was also going to hold. This had to have been a real shot of confidence to bulls in this stock as the year drew to a close.
When CERN made yet another higher high in late-January 2012, apparently, a lot of bullish interests were taking note, as evidenced by the spectacular gains seen just on Wednesday. Smart traders are always monitoring the swing factors on the charts of the stocks they follow.
Noting the juxtaposition of shorter-term swings against the landscape created by the larger-degree swings, traders realized that the short-term daily uptrend in CERN would be confirmed on a daily close above $63.82, and they really outdid themselves in this case by gapping the stock way above that key swing high during Wednesday’s mammoth move.
While it would be very normal to see some short-term profit taking after such a massive one-day move higher, it seems that little will be in the way to block an attempt by CERN to make a run at the July swing high value of $74.39, and savvy swing traders on the 30- to 60-minute time frames should have little trouble locating suitable long entry points along the way, should CERN indeed follow through and try to take out that key resistance price.
And no matter what happens, there should be plenty of exciting chart action to take note of as this stock decides what it wants to do in the next week or two.
By Don Pendergast, independent trader and system writer


