It takes a bit of calculation time, but this strategy can be consistently profitable in today's markets.
One of the more aggressive short-term trading systems built into MetaStock 11 is the Long Sell Short Sell system found in the Explorer feature of the program. If you don't use MetaStock, you can probably find a similar system in your platform.
This system attempts to profit from short-term cyclical price action, and appears to work well when trading stocks under two types of market conditions:
- When a stock is in a well-defined range, making many short-term swings within the range
- When a stock has made a minor pullback just before embarking on a strong trending move.
I've been looking at this system for some time now, and actually traded a long position-only version of it successfully during the spring of 2009 using a basket of stocks. Here's an updated version of the method, complete with additional confirming indicators and relative strength filters included.
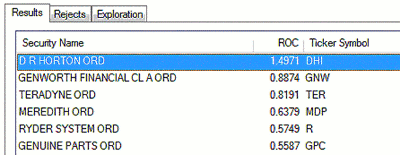
Here are the top relative strength stocks versus the SPX that fired Long Sell Short Sell trading signals during the middle of February:
This is actually pretty simple, and the method I'm about to describe could eventually turn into a consistently profitable trading method for a serious trader who is disciplined, patient, and able to handle modest drawdowns. Additionally, the trader should be willing to tweak, test, and retest the methodology as market conditions evolve, and as his/her skill and confidence level (and hopefully their account size) continue to increase.
With that said, here we go. Use the S&P 500 and S&P 400 component stock list as your raw material to seek qualified trading candidates, running them on the Long Sell Short Sell (signal) exploration at the end of the daily trading session.
You'll have a variety of long and short trading candidates to choose from, so what you want to do is determine your broad market bias by seeing if the SPX is trading above its nine-week exponential moving average (EMA). If the index is above the average, take only long candidates, and if it's below the average, you'll want to stay on the sidelines in the safety of cash.
Right now, the SPX is well above its nine-week EMA, so let's only consider long positions. What you want to do now is focus on the top 13-week relative strength (versus the SPX) stocks in the list, and then do a little fundamental research to eliminate any stocks that have a poor earnings growth rate projection.
Finally, you also want to see that a long candidate is also trading above its 21-day EMA, and that its 89- or 100-period Chaikin money flow indicator is above its zero line. (You're going to need to put in about an hour of scanning and research and confirmation time if you're going to trade a part-mechanical, part discretionary method like this, so make sure you can consistently make time for this essential task.)
Depending on market conditions, you still may have a number of stocks to choose from, so try to select the best two candidates in terms of these critical factors:
- Strongest relative strength versus the SPX
- The best earnings growth rate projection
- The strongest Chaikin money flow reading
There is one other filtering consideration, one that I discovered by way of extensive testing, and that is to limit the portfolio size to a maximum of four to six stocks, putting on no more than two new positions per day. Putting on positions a little at a time helps limit portfolio drawdown significantly, and can help improve profitability over time.
Finally, once in a position (entering at the next session's open after a buy signal) place a 5% to 7% initial stop-loss and hold it until an opposing sell signal appears.
One version of the basic method allowed me to run a small $8,800 cash stock account up to nearly $9,850 in a little more than four weeks, from early April 2009 to early May 2009. I moved on to other methods that I felt were more promising and less research-intensive later in May 2009, but I was impressed with the method.
|pagebreak|The big drawback, of course, is that because of all of the discretionary filtering involved, there is no practical way to accurately back-test such a method. It could easily be forward-tested, however, provided you are patient and self-disciplined.
These LSS trading signals sometimes work best when a stock or exchange traded fund is trading in a well-defined range, or is pulling back just before a major market swing is to commence.
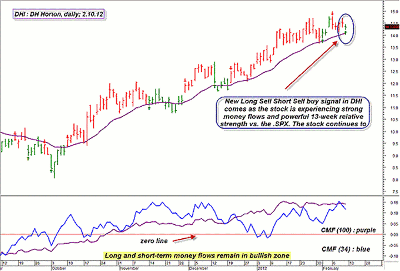
One of the candidates that came up with this scan is DH Horton (DHI). While I haven't confirmed the fundamental attractiveness of the stock, by every other metric of the method it looks like a potentially sound long buy set-up:
- Top relative strength among its peers firing similar buy signals
- Strong short- and long-term money flows
- DHI is trading above its 21-period EMA
This was from mid-February, so be sure to check current pricing, strength, and moving averages before placing any trade.
This simple trading method may be worth pursuing, but I suggest you only do so in paper-trade mode to see if you could deal with all the daily research and confirmation work needed to operate it. For truly committed and self-disciplined traders, it could be a valuable learning experience.
Don Pendergast is an independent trader and trading system writer.


