

Fibonacci and multiple time frames provide a clear technical picture for silver that traders can use to capitalize on additional upside if key support holds, or play the downside if the support level is broken.
Commodity traders want to know if the end is near for silver’s long-term bull run. The last few months have seen quite a bit of wobble since the meteoric rise in early 2011.
Despite its recent drop, silver currently rests above a key confluence support price level. Let’s identify this level and develop a game plan whether this support level holds or fails.
Here’s the weekly structure with a Fibonacci grid:
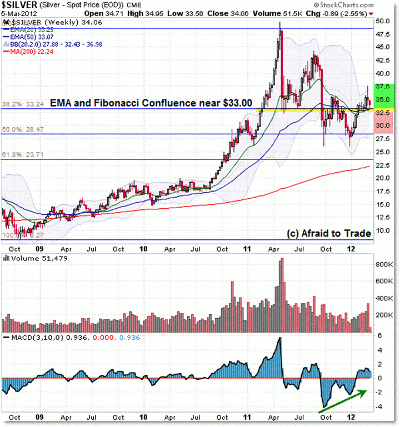
Click to Enlarge
Silver developed a downtrend after spiking into the $50.00-per-ounce area. Since then, price has been on its way to find value at lower levels.
However, the recent 2012 action broke not just the falling weekly exponential moving averages (EMAs), but also the falling “bull-flag”-style trend line, all near the $33.00-per-ounce level.
Now, we see the critical importance—at least from the chart perspective—of the $33.00 confluence support pivot.
It serves as the underside of the falling “flag” trend line, the 38.2% large-scale Fibonacci retracement, and the crossing of the 20- and 50-week EMAs.
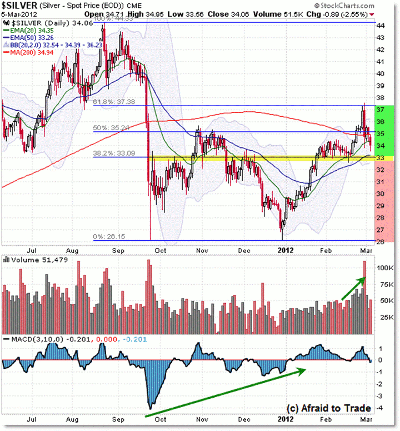
As usual, the daily chart clarifies the short-term picture and also reveals another Fibonacci level at $33.00.
Click to Enlarge
We see the short-term Fibonacci retracement grid in terms of the recent upside action in 2012, and the 38.2% upside retracement rests almost exactly at $33.00 per ounce.
To make matters more interesting, the 50-day EMA also rests near $33.00 (at $33.26 currently).
Price stalled/reversed from the upper 61.8% Fibonacci level, which gave a bit of a bull trap, as price broke and impulsed above the 200-day simple moving average (SMA) and prior resistance from the November 2011 price high near $35.00.
So what’s the bottom line?
To summarize, $33.00 is likely the dividing line between whether to expect a future move back to the $38.00 level if support holds, or else a breakdown towards the $28.00 level if this confluence fails.
Part of technical analysis is finding confluence levels that are important pivot points and then developing if/then game plans in real time as price moves towards or away from these levels.
It would be a bearish short-term development should the confluence support at $33.00 fail, so that will be the level we’ll use as a simple, chart-based pivot reference level for silver prices.
By Corey Rosenbloom, CMT, trader and blogger, AfraidToTrade.com


