

A remarkable early-year rally in shares of Sears Holdings (SHLD) may soon reverse, says Greg Harmon, and traders may look to short the stock back down to one of three clearly defined price levels.
On January 7, Sears Holdings (SHLD) was showing a sharp decline on the chart. The decline was so fast that a momentum measure, the Relative Strength Index (RSI), dropped to 12.This indicator can only move between 0 and 100. The closer it gets to either 0 or 100, the harder it is for it to continue in that direction.
Most technicians use measures of 30 as being oversold and 70 as being overbought. So a drop down to 12 is very oversold. That is where the chart was on January 7 when I posted the chart below with the caption “Stores Suck But Come on, RSI is 12!”
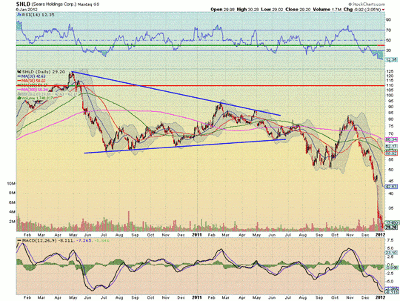
Click to Enlarge
The RSI can correct through time or by price reversing, so these extreme measures offer a potential trade opportunity, and starting in January, it’s been a doozy, rising from $30 to $77.63, where it closed last Thursday.
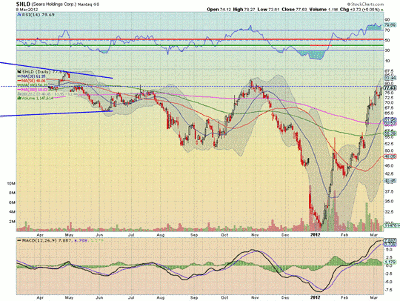
Click to Enlarge
Now it is in the opposite situation, offering an opportunity to trade it lower. The chart also shows it happens to be at resistance, adding weight to a potential correction in price. Look for the pullback to begin, and then ride it lower to support at $68, the simple moving average (SMAs) at $60, or the gap at $55.
There is no guarantee it will fall, but the history on the chart shows it would not be unexpected.
By Greg Harmon of Dragonfly Capital


