

Tenuously positive price action is shown on the charts for two primary emerging market ETFs, says Corey Rosenbloom, but watch for any breaks of important price levels to signal new moves higher or lower.
Traders and investors often use popular emerging markets ETFs like the iShares MSCI Emerging Markets Index Fund (EEM) and iShares MSCI EAFE Index Fund (EFA) for assessing overseas markets quickly, so let’s take a moment to view the key short-term barrier levels—mainly resistance and support—to watch for any key breakouts from this area.
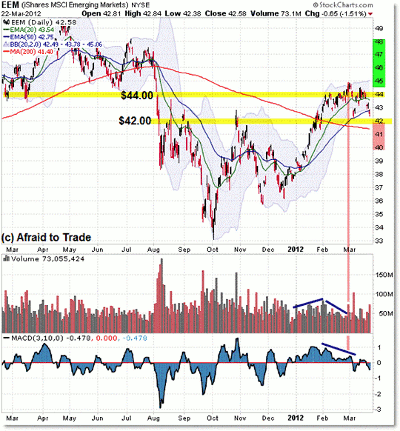
Let’s start with the EEM daily chart:
Click to Enlarge
Let’s start with a brief description of the trend in motion (which applies to both charts).
Price is in a tenuous daily chart uptrend, as suggested by the bullish 20- and 50-period exponential moving averages (EMAs) along with a short-term series of higher highs and lows.
Price is also above the 200-day simple moving average (SMA), which is bullish unless proven otherwise with a breakdown under this key indicator ($41.40 currently).
I say it’s a “tenuous short-term uptrend” due to the negative volume and momentum divergences similar to those plaguing the US equity Indexes from their reversals higher from October 2011.
Unlike the US equity indexes, both EEM and EFA remain well below their respective 2011 peaks (a sign of relative weakness to the US indexes).
That brings us to the two key short-term levels to watch in these ETFs:
For EEM, the upper resistance “polarity” line rests at $44.00 per share, while the lower support level trades not as convincingly at $42.00 per share (again, above the rising 200-day SMA).
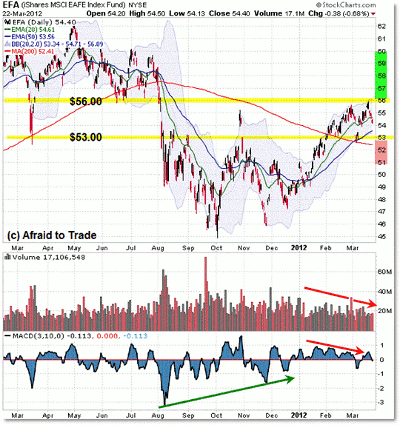
As we’ll see below, the upper polarity resistance in EFA rests at $56.00, while the lower support and rising 200-day SMA overlap near $53.00 per share.
Here’s the chart for EFA, which tracks Europe, Australasia, and the Far East:
Click to Enlarge
EFA traces out an almost identical structural (price) pattern—and levels—to EEM.
The divergences are still present with the 2012 rally back to (and slightly above) the respective October 2011 high.
Watch these reference levels for any continued bullish breakthroughs higher, or else focus on the support shelf (and any breakdown) under the price level and 200-day SMA indicator.
A breakthrough could trigger an “open air” movement on to the next price target level.
By Corey Rosenbloom, CMT, trader and blogger, AfraidToTrade.com


