The falling wedge pattern seen in Royal Gold (RGLD) isn’t enough by itself to validate a buy, warns Gary Tanashian, but confirmation on the daily and weekly charts suggests a solid long entry could soon emerge.
Falling wedges and rising wedges are the most overhyped patterns in technical analysis, both in their bullish/bearish directional signals and in their bullish/bearish intensity when they do manifest.
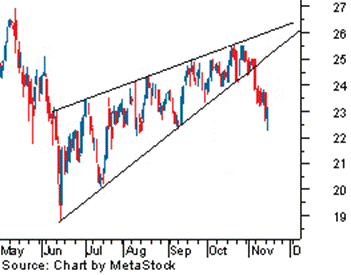
The rising wedge is a bearish pattern that begins wide at the bottom and contracts as prices move higher and the trading range narrows:

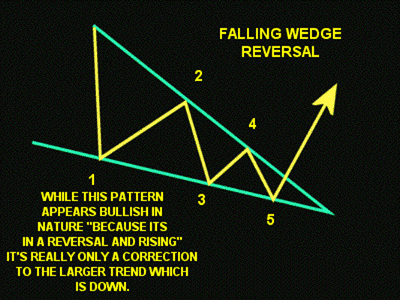
The falling wedge is a bullish pattern that begins wide at the top and contracts as prices move lower:
I have found both patterns to be of questionable reliability, but when matched with other indicators, they can work well.
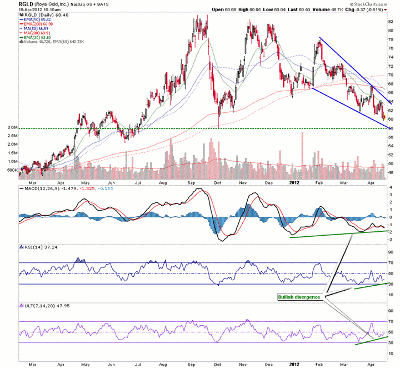
Royal Gold (RGLD) is in a falling wedge, which is thought of as a bullish pattern. Royal Gold, Inc., together with its subsidiaries, engages in the acquisition and management of precious metal royalties. It owns royalty interests in various producing, development, evaluation, and exploration stage projects that explore for gold, silver, copper, lead, and zinc metals.
Adding in some bullish divergence, one might think the short-term downside is limited to $58, with the potential for a rally to the mid-$60s and the 50-day moving averages.
A weekly chart, however, shows much stronger support in the mid- to low-$50s, which I think could be a more solid buy if it registers.
Another reason why looking at longer-term time frames is critical for short-term traders.
By Gary Tanashian of BiiWii.com
Have you found these types of wedge patterns to be reliable? Leave your answer in the comments section below.


