After running a scan to uncover the most overbought and oversold S&P 500 stocks, Corey Rosenbloom describes two strategies that can used to profit from possible price swings.
Which stocks are most over or under-extended from their 200-day simple moving average? Let’s take a look at the current scan results and the opportunities these stocks may present.
First, here are the most bullishly overextended stocks in the S&P 500:
This scan returns the percentage distance above or below the 200-day simple moving average as a quick measure of trend strength or price overextension.
When you’re looking at these stocks, eliminate those which have a sudden or large recent gap, which will skew the percentage, especially in low-priced stocks.
What you want to identify is a salient, persistent trend on the daily chart, and from there, you have two specific trading strategies:
- “Fade” traders can look to play short for a quick scalp trade from an overextended new high to target a quick move back towards the 20-day moving average or else some sort of lower support trend line.
- Pro-trend retracement traders instead will identify the strong trend in motion and then look to buy (put on swing positions) as price returns to these rising trend lines or moving averages for a low-risk, pro-trend retracement trade.
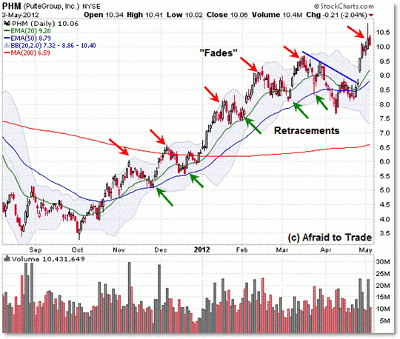
Let’s see how these have worked recently in our most overextended stock, PulteGroup (PHM):
The red arrows indicate countertrend “fade” trades (those that seek to enter into the upper Bollinger band on an extended price swing and target rising moving averages or trend lines as price works off the overextension).
The green arrows indicate typical pro-trend retracement trades which seek to enter on the pullback to trend lines or moving averages, or else on the break above a falling bull flag trend line (for a less-aggressive entry).
Watch to make sure you see steadily rising volume on each upswing to have greater confidence in a successful retracement outcome (targeting at least the prior swing high or into the upper Bollinger band).
Not all retracements work perfectly, and the April move under $8.50 in PHM is an example of a retracement that went deeper than expected, yet the trend still continued higher, which brings us to our current overextended rally (a chance for short-sellers to play against the recent swing).
Others among the top five overextended S&P 500 stocks include Lennar Homes (LEN); Regions Financial (RF), a low-priced stock; Gap Inc (GPS), a popular retail/clothing store; and Masco Corp (MAS).
NEXT: The Logic for Trading Oversold Stocks
|pagebreak|It’s generally a good sign for the economy that the top extended stocks are two homebuilders, a financial company (albeit a small one), and a retail company.
The logic is just the opposite for the top five underextended stocks, which include:
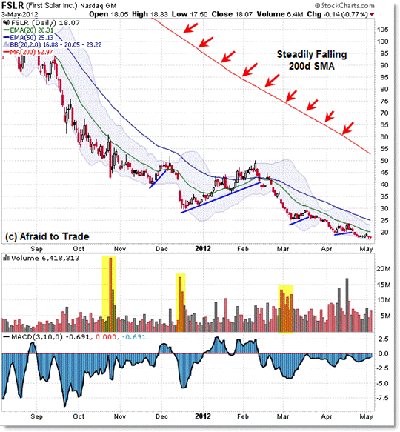
I’ve been doing these scans frequently, and one name seems to keep reaching the top of the list: First Solar (FSLR). From the chart, it’s easy to see why:
First Solar is becoming a case study in pro-trend logic (“The trend is your friend,” “Do not fight a trend”). Again, pro-trend retracement traders had numerous retracement, or bear-flag style opportunities all the way down. While the trend has been strongly negative, countertrend fade traders have also had successful swings or quick scalps in the stock, which are good for quick, aggressive, $5.00 to $10.00 scalp swings.
It’s worth noting that countertrend scalp strategies should only be deployed by aggressive and preferably very experienced traders. New or developing traders should play the safer pro-trend retracement opportunities, which carry lower risk and defined entries and stop losses.
The remaining stocks on the underextended list include NetFlix (NFLX), which garnered a lot of attention during its decline from its $300 per-share peak; Alpha Natural Resources (ANR); Chesapeake Energy (CHK), which also has appeared in prior underextended scans; and MetroPCS Communications (PCS).
Remember, this is a quick scan for potential trading opportunities depending on the style of trader you are and the strategies you use.
Don’t just scan and trade; do a bit more homework before putting on any trading position, though these types of scans can reveal names you might not consider otherwise.


