It’s true that indicators and historical patterns are suggesting a market bottom, writes Chris Perruna, but because past bottoms have taken weeks or even months to formally complete, it’s a reminder for traders to “be patient!”
As I surf the Twitter and blog world, I see an unusual number of people claiming a market bottom based on “historical readings” among many of the secondary indicators.
Several of my indicators are also starting to enter those same levels, but what many are failing to realize is that the market can take several months to complete a full correction and reach a bottom.
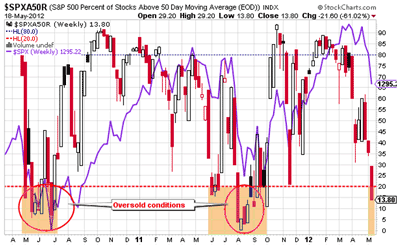
See the chart below for the most recent two-year chart with individual corrections for both of the recent bottoms in 2010 and 2011 (highlighted below the 20% figure).
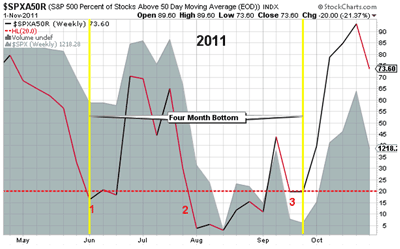
As you can see in 2011, the secondary indicator started to flash “bottom” signals in June, but the market didn’t complete its volatile correction until September.
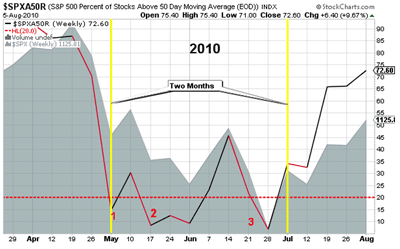
In the summer of 2010, the secondary indicator started to flash “bottom” signals in May, but the market didn’t complete its correction until July: two full months of up-and-down action.
The lesson: 2012’s secondary indicators started to flash a market bottom last Friday…for the first time.
Based on past corrections (going back a decade), this will only be the start of a volatile period of up-and-down action that could last several months (the swings can be greater than 10%).
Be patient!
See also: The Ultimate Sign a Stock Has Bottomed
By Chris Perruna of ChrisPerruna.com


