

With technical signals pointing to continued weakness in shares of Amazon.com (AMZN), Greg Harmon of Dragonfly Capital outlines four high-probability trading ideas for the popular online retailer.
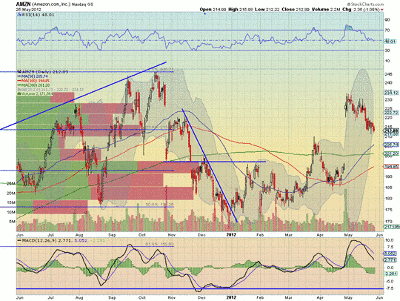
Amazon.com (AMZN) has been moving lower from a gap higher to $234. The Relative Strength Index (RSI) is falling and the Moving Average Convergence Divergence (MACD) indicator is growing more negative, both supporting further downside.
On Friday, it broke below the mini consolidation as the Bollinger bands opened lower. There is support lower at $206.88 and $197, followed by $185.75 and $175. There is also the $200 round number in between.
Notice that the biggest price by volume bar is found at $197 as well. Resistance higher is found at $221 and $227, followed by $234 and $241.
Click to Enlarge
Trade Idea 1: Enter short with a $5 trailing stop. Take off one third of the position at a gap fill at $196.38.
Trade Idea 2: Buy the June 210 puts (offered at $5.60 recently) and trade them using the same $5 trailing stop on the stock and the same profit target.
Trade Idea 3: Buy the June 210/195 put spread ($3.75). Buying the June 210 put and selling the June 195 put, this has a reward-to-risk ratio of 4:1, a maximum profit of $11.25 on a close at $195 or lower on June expiry, and starts making money on a close under $206.25.
Trade Idea 4: Buy the June 210/195/185 broken put butterfly ($2.88). This is buying both the June 210 and 185 puts and selling two of the June 195 puts. It has a maximum profit of $12.12 on a close at 195 on June expiry and that profit trails off below $195 to a minimum of $2.12 on a close at $185 or lower. It starts making money, net of the premium, at $207.12.
See also: Trade Down Moves without Going Short
By Greg Harmon of Dragonfly Capital


