Traders who are tempted to try to pick a bottom for natural gas this summer and go long into the seasonally strong winter months need to wait for a very specific price trigger, explains Greg Harmon of Dragonfly Capital.
Natural gas futures and the related ETF, the United States Natural Gas Fund (UNG), track a cyclical commodity. Well, that is what everyone thinks, anyway. Rising in the winter as demand grows to heat homes and falling in the summer as the planet heats up.
That may have been the case historically, but not the last two years. It has remained cyclical, but only in terms of traders trying to pick a bottom in it.
This cycle is much shorter now, about four to five weeks. The last time we checked in on natural gas in mid-May, it was showing signs of a potential reversal. With trader interest peaking again, it has yet to follow through on that potential and is showing signs of a fizzle.
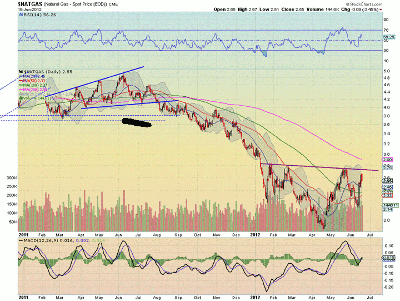
The daily chart below shows the latest pullback in mid-May after failing to reach the previous high from January and February. The low in June and reversal higher immediately bring to mind a possible inverse head-and-shoulders pattern.
A break of the neckline near $2.73 would bring a price objective of at least $3.60. That would certainly make the bull case. But it is weakening, printing a dark cloud cover candle pattern with the Relative Strength Index kinking back lower.
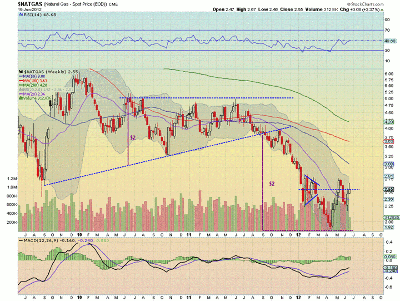
Moving out to the weekly picture shows the latest week pulling back at the center line of the old symmetrical triangle and lower than the previous high.
None of this precludes the breakout of natural gas higher, but equally important, none of it is a buy signal, either.
There is at least a basing going on. That basing could reverse higher, or, as we have seen many times in the past few years, it could just as easily continue lower. There is nothing to do here on the long side until the January/February high is taken out.
By Greg Harmon of Dragonfly Capital


