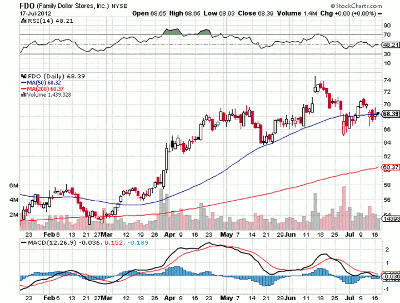
This deep–discount store has been forming a pennant pattern, which could be signaling an eventual return to the uptrend.
Over the past two months, shares of Family Dollar Stores (FDO) have been forming a potentially bullish pattern on their daily chart.
Since reaching correction lows in mid–May around $64 a share, FDO has rallied, then corrected down to a higher second correction low near $65 a share in late June.
In mid–June, FDO reached a new high near $73 a share. After correcting, FDO again rallied and reached a lower rally high near $71 a share.
Lower highs and higher lows. This creates a pennant pattern on the chart if you connect these highs and lows.
Typically pennant patterns, when broken as all eventually are, follow–through in the direction of the prior trend. In this case, the trend was to the upside.
We would expect FDO to break out of this pennant pattern to the upside and begin a new advance, testing and potentially breaking the prior June highs. Should FDO break lower and close below the 50–day moving average, we would take no position and await further data.
Frank Kollar can be found at FibTimer.com.


