Brandon Wendell, trading instructor at Online Trading Academy, explains why index ETF traders may be missing key information if they are not watching the index future.
As I was teaching a Trading Plan course in Online Trading Academy's Stamford center today, I was asked why prices on some ETFs did not always reach supply or demand before turning sharply. The student was upset because they were missing trades or even getting stopped out too early.
Exchange traded funds are securities that represent ownership in a basket of stocks. They are similar to a mutual find in that you gain diversification from participation in multiple securities, and can even receive dividends. But unlike mutual funds, they trade like a stock, and can be bought or sold at any time during the trading day or after-hours trading session. The ETF is also passively managed, meaning that there are no managers constantly changing the basket composition.
Some of the most popular ETFs are the ones that track the major indexes or commodities. They are designed to mimic the movement of those indexes with a nearly perfect correlation.
Notice that I said nearly, but did not say a perfect correlation. The reason they do not always move together is because they are different securities traded on different markets, and have varying supply and demand pressures placed upon them.
This leads to an interesting question for trading: "Should I chart the ETF or Future for trading?" The answer is both! If you are a stock trader, you want to chart the ETF for identifying your entries, targets, and stops. This is where you will manage the trade itself.
But charting the future that corresponds to the ETF you are trading will give you an advantage when looking to trade. If you want additional confirmation for buying at a demand zone in QQQ, you can look to see if the NQ futures are also at demand.
This multiple view of related securities becomes interesting when the two do not touch the supply or demand at the same time.
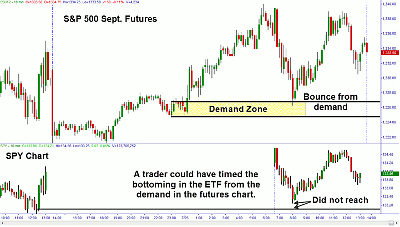
In the above picture, the S&P 500 e-mini futures bounced from a demand zone that was created in the Globex session. This is a time when the stock market is not open, and therefore no demand was touched in the SPY ETF.
The Globex is a nearly 24 hour, electronic trading futures market. It can be very important for the stock trader to view the Globex supply and demand levels to obtain additional zones where prices may bounce in the futures and thus cause the ETF's to turn.
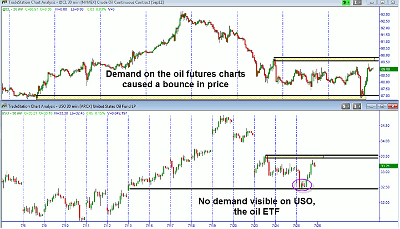
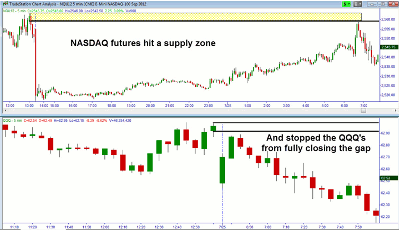
We can also see that the supply or demand may not be visible in the ETF. Looking at the following examples of oil and the NASDAQ, the futures helped us find turning points in both ETFs.
So charting the futures to trade ETFs and stocks is another odds enhancer that traders can use to increase their success. For more, or to learn how to chart them properly, visit your local Online Trading Academy center and sign up for a course.
Brandon Wendell is a trading instructor at Online Trading Academy.


