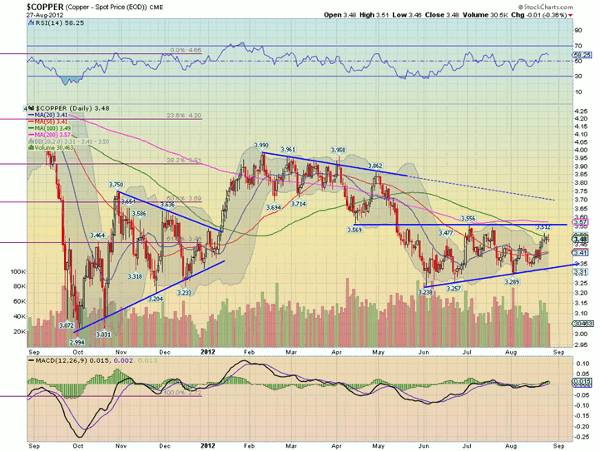
Greg Harmon of Dragonfly Capital outlines a few technical aspects of copper that indicate it may be ready to break away from its current price range.
Copper may be ready to start its next phase. Over the last year, it has traded in three- to four-month ranges before bouncing to the next range: The October to mid-January Symmetrical Triangle. The downtrending consolidation from February to mid May. And the latest the ascending triangle that began in mid May is now three and a half months old.
Time for a change. Question is, which way? The Relative Strength Index (RSI) has been trending higher and is on the verge of a turn to bullish territory over 60. But looking left, it has failed here twice before since the beginning of July.
And the latest run higher is now showing topping candles. The key for the next four-month cycle seems to be the 3.57 level. A move over that line should trigger a rise and retest of the extension of the previous downtrending resistance, adding credence to a long symmetrical triangle.
A failure there could break the pattern and continue to move in the range between 3.30 and 3.57. No direction on copper or news on its perspective on the economy until that level is resolved.
Greg Harmon can be found at Dragonfly Capital.


