Corey Rosenbloom presents with minimal comment the surprising facts about how markets have performed under our last several presidents.
With the 2012 Presidential Campaign now in full swing, I thought it would be interesting to observe prior performance of the stock market under the different presidential administrations from Jimmy Carter to Barack Obama.
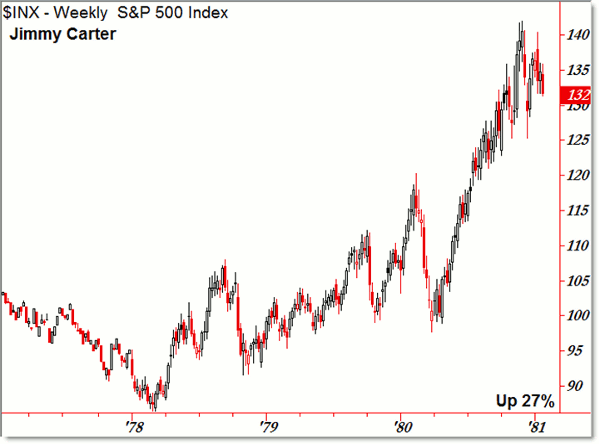
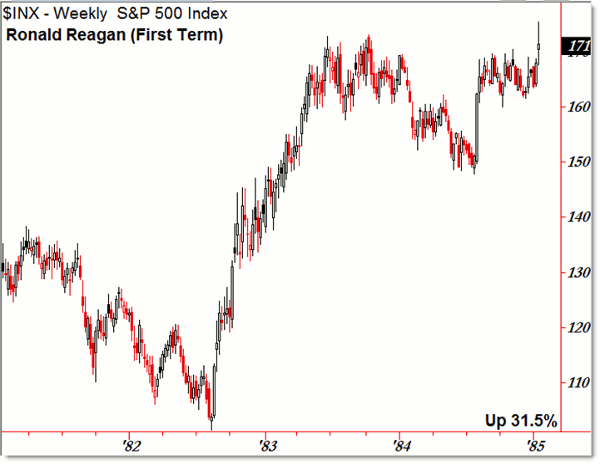
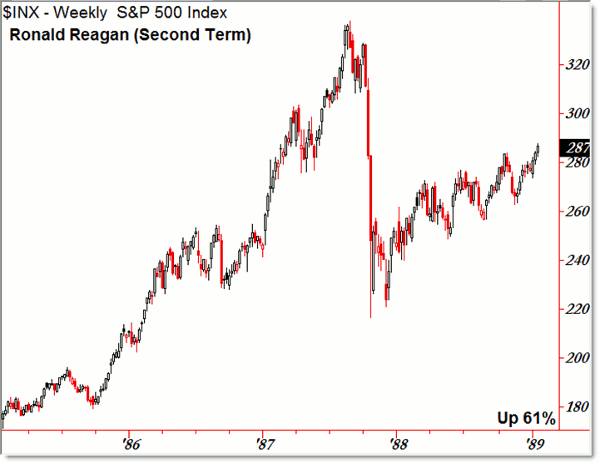
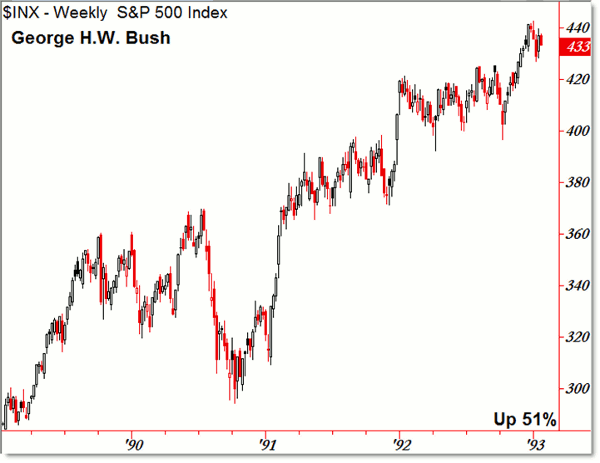
The charts below all begin and end on January 20, the starting and ending day of a presidential term, for comparison purposes. Each chart plots the S&P 500 Index activity throughout each term. Charts are presented without commentary and without any sort of bias.
Be sure to read the brief caveats at the end of the article.
Jimmy Carter, 1977 to 1981:
Ronald Reagan (1st), 1981 to 1985:
Next: Ronald Reagan (2nd), 1985 to 1989
|pagebreak|Ronald Reagan (2nd), 1985 to 1989:
George H. W. Bush, 1989 to 1993:
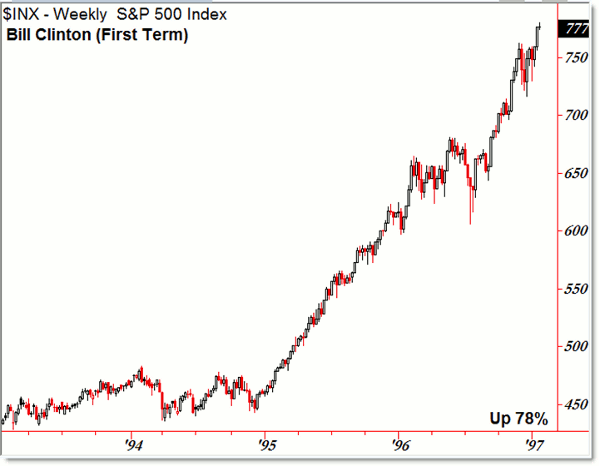
Bill Clinton (1st), 1993 to 1997:
Next: Bill Clinton (2nd), 1997 to 2001
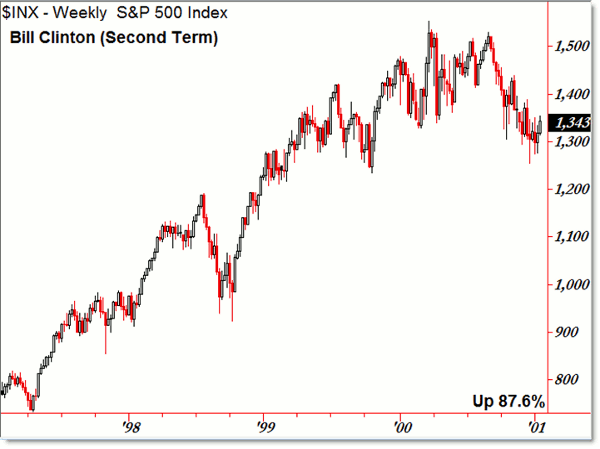
|pagebreak|Bill Clinton (2nd), 1997 to 2001:
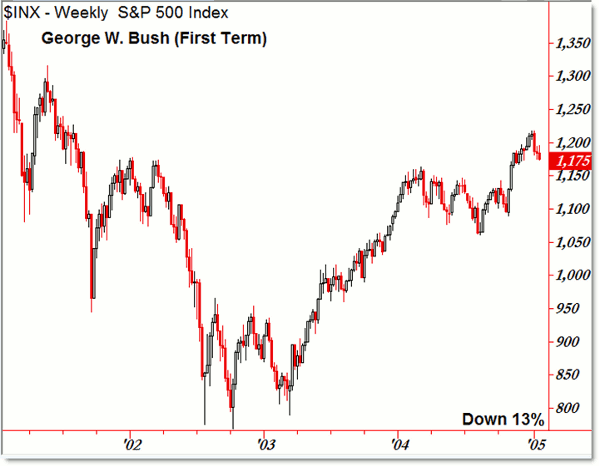
George W. Bush (1st), 2001 to 2005:
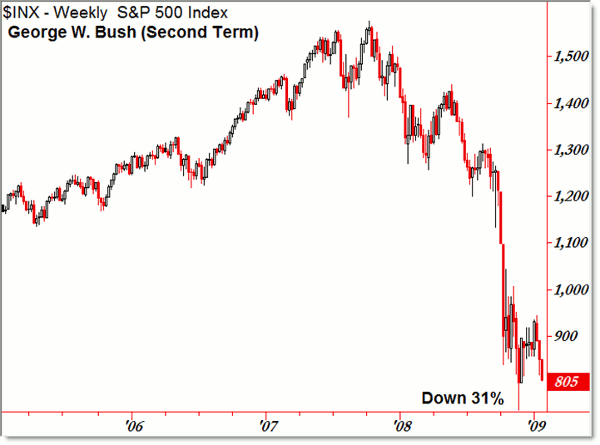
George W. Bush (2nd), 2005 to 2009:
Next: Barack Obama (5 months remain), 2009 to 2013
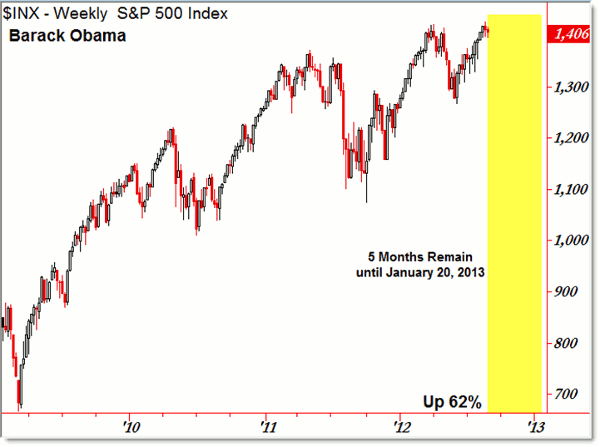
|pagebreak|Barack Obama (5 months remain), 2009 to 2013:
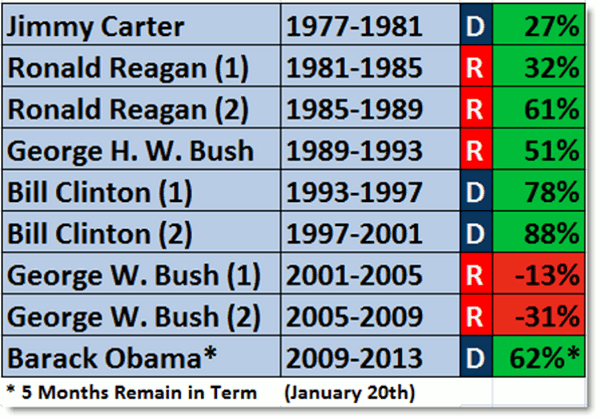
Composite S&P 500 Percentage Performance (by term):
Next: Quick Caveats
|pagebreak|Quick Caveats
- No president can implement all the policies he wishes.
- Administrations are constrained by Congress (House and Senate), lobbyists/interest groups, public opinion, and finally the Supreme Court.
- Many presidents have encountered “Divided Government,” where the Congress is controlled by the opposition party (Reagan, Clinton, and Obama, for example).
- Events always occur that are out of any president’s control. Also, the government does not control the economy.
- Policies that help or hurt the free-market economy include tax policies (rates), regulatory policies, and federal budgetary policies/investment (to name a few).
- Policies implemented may take months or even years to affect the economy.
- A better method for assessing stock market and presidential performance may be to start the comparisons after the first full year of a new administration (with the exception being the re-election of incumbents)
- The policies of the independent Federal Reserve (interest rates, stimulus) greatly effect the broader economy.
Despite the numerous caveats for extrapolation, it’s interesting to observe how the stock market has performed over specific administrations, particularly with respect to major events (1987’s crash, the late 1990s tech bubble, the early 2000s tech crash, the September 11, 2011 terrorist attacks, and the 2008 crash).
The most interesting observation I had is that the stock market has such a bullish four-year performance over all administrations, save for 2001 to 2009 (two recessions occurred like bookends to the decade).
As the campaign continues into the November 2012 election, it’s interesting to learn about stock performance under prior administrations and policies.
Corey Rosenbloom is a trader and blogger at AfraidToTrade.com.

