Greg Harmon of Dragonfly Capital takes a look at the natural gas futures market on several time frames for clues as to where price is headed next.
Two weeks ago, natural gas futures looked poised to move lower on a longer-term basis, when I wrote Natural Gas Is Fizzling. The total body of the daily, weekly, and monthly timeframes is still pointing lower, but the shorter view has an upside bias. So that is not working out so well so far.
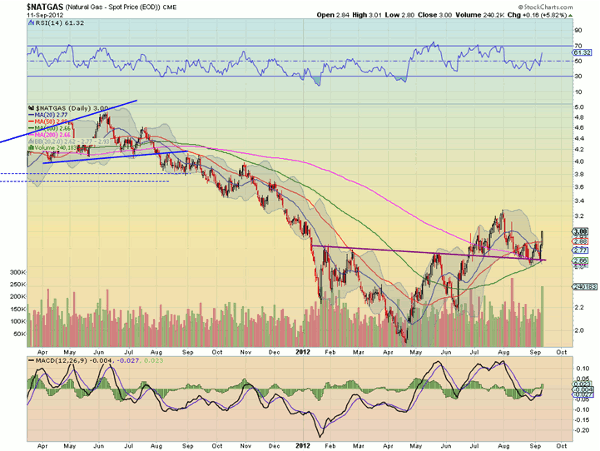
Is the short-term view strong enough to overcome the monthly view? Let’s take a look. Here is a daily chart:
The daily view above is now moving higher after retesting trend line support and making a new high. The Relative Strength Index (RSI) is moving into bullish territory, and the Moving Average Convergence Divergence indicator (MACD) is positive and moving higher.
Looks like a short-term breakout higher on this time frame. If it can get above 3.30, it should gather some steam and may pull the monthly view higher as well.
Next: What about the weekly chart?
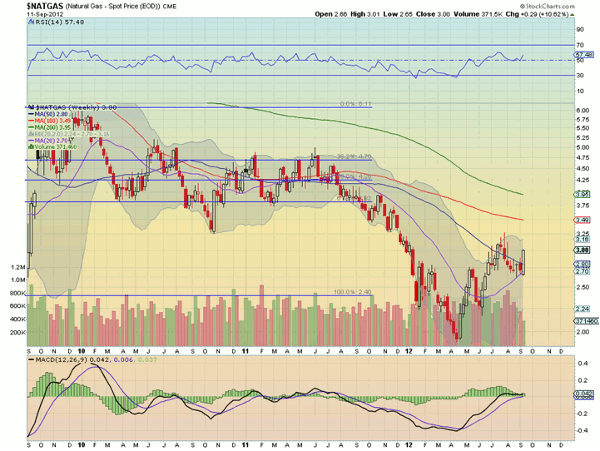
|pagebreak|What about the weekly chart? Well, it is making a higher low and with a bullish engulfing candle (albeit only two days into the week):
Finishing here or higher—another higher high over 3.25—will go a long way towards strengthening the upside case. The RSI is not yet in bullish territory, but is rising, and the MACD is turning back higher, averting a cross to negative.
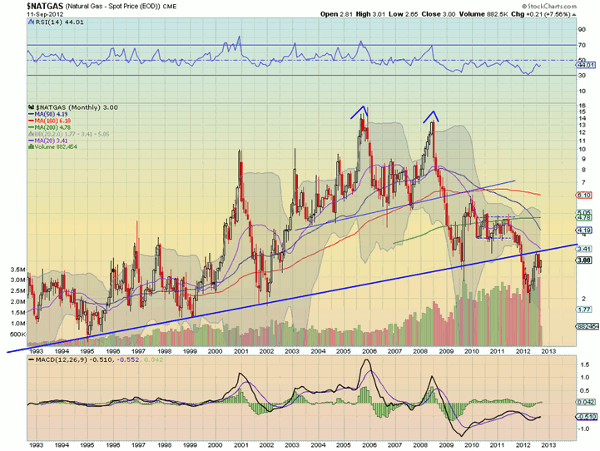
These shorter-term views are trying hard to correct the monthly view, which is failing an uptrending resistance:
Whether they can turn the tide may take a few months to find out, but the short term view looks cautiously higher. If you are in this trade for 25 cents then, Giddy up! If you are looking for a $3 move then you had better remain cautious.
Greg Harmon can be found at Dragonfly Capital.


