I don’t even know how many charts I’ve read over the years, but there are a couple of commas involved. I’ve been able to identify quite a few patterns and benefit from them. Of course, I’ve been wrong a lot too.
What’s funny is that in this game, as long as you’re managing your risk well, you can sometimes be dead wrong on the pattern and still make money. Let me give you an example.
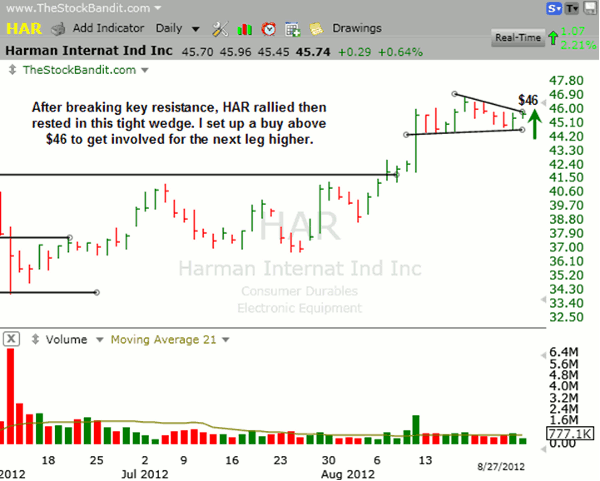
A few weeks ago, I noticed Harman Int’l Inds (HAR) as a stock which had cleared an important area ($42 in early August) and then had settled into a rest phase. I drew my trend lines and recognized a wedge, which was also a pennant after the advance in price. I set up a buy for $46 to get long on a return of strength.
Here’s a look at the chart of HAR when I set up the trade and my reasoning for entering:
Next: That buy triggered the next day, but...
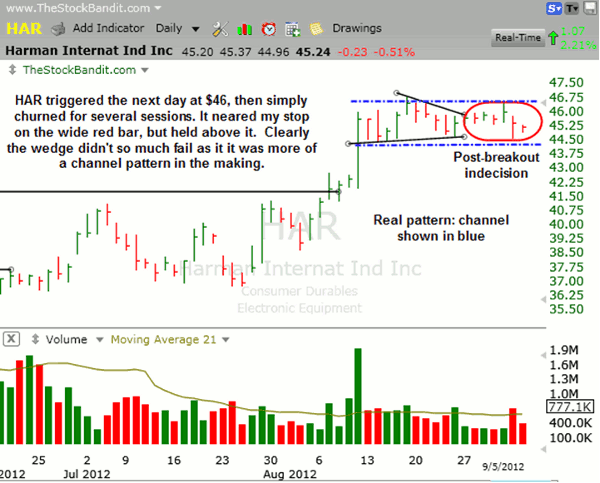
|pagebreak|That buy triggered the next day, but the stock couldn’t get going. It actually churned for the next six sessions, including a test on day five of my stop, holding just a short distance above it to keep me in the trade. That dip was a test of support, but I was leery because I considered this to be a failure of the pattern and I expected to be taken out of the trade for a small loss.
Here’s the HAR chart at that point in the trade, and I began to realize the pattern was now a large channel and still intact:
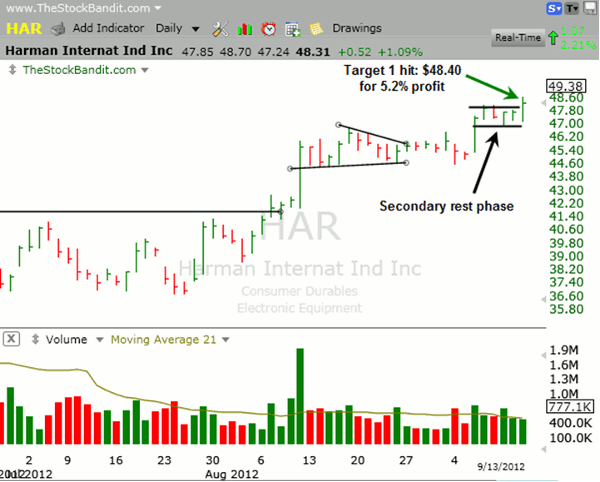
This gave me a bit more confidence in the trade when the next day prices lifted to create a little breathing room to my stop. It showed a bit more follow-through, then held for a few days before hitting Target 1 on Thursday for a 5.2% profit.
Here’s a look at HAR after the return of strength:
Next: This gave me an opportunity to lock in some...
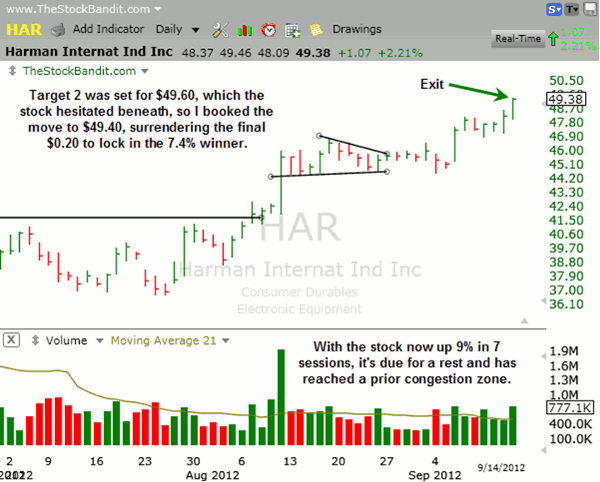
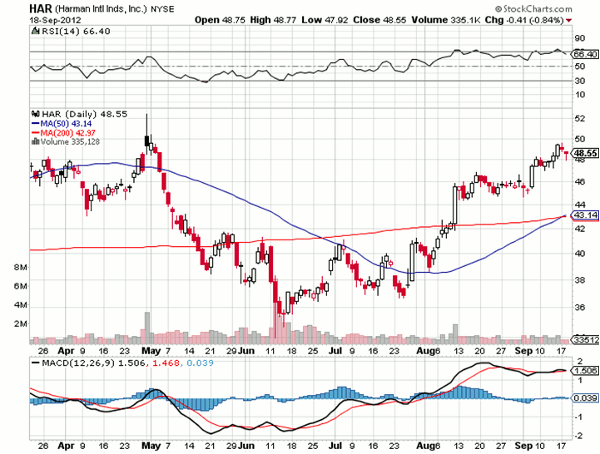
|pagebreak|This gave me an opportunity to lock in some gains and tighten my stop for remaining shares, which I did. Then on Friday, the stock rallied again, but hesitated 14 cents shy of Target 2, which was set at $49.60. Rather than hope for an extra few cents while risking more than $2 (my stop had been moved to $47), I booked the 7.4% winner and notified Bandits of my adjusted exit.
Here’s a look at HAR just after the trade:
This stock may still hit Target 2, but with it being up over 9% in the previous seven sessions, it was due for a rest as it approached a congestion zone from late spring.
When you’re setting up a trade, you evaluate the price action. But that evaluation doesn’t stop once you’re in. You have to keep asking questions of whether the risk/reward is worth staying in the position.
This one had come to a point where stretching for a tiny bit more wasn’t worth the risk, so I took the solid profit with a smile. After all, my initial diagnosis of the setup was wrong, but I was still able to book a nice gain.
Jeff White is a trader and blogger at The Stock Bandit.


