Corey Rosenbloom uses three different perspectives here, each of which gives important information that traders can use.
I think a lot of traders were surprised by the sharp sell-off last week in crude oil from the $100 resistance level. Let’s take a look at the weekly and daily chart to learn the key levels to watch, and what the structure suggests about potential opportunities in the near future.
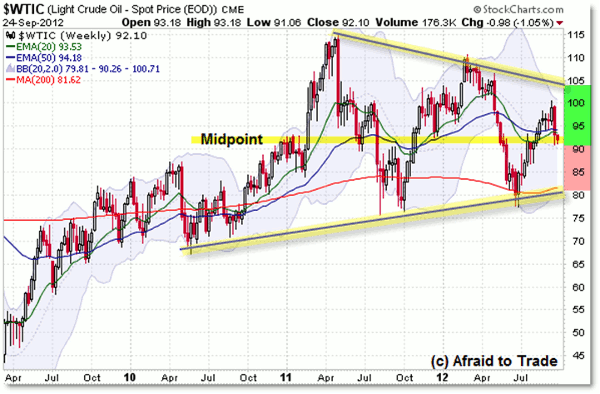
First, we have the weekly chart perspective, which shows a very broad consolidation pattern:
We see oil’s rising trend structure, beginning with the early 2009 bottom all the way to the mid-2011, and the consolidation pattern (like a triangle) which has developed.
A falling resistance trend line ends near $105, while a rising support line intersects the rising 200-week SMA near $82 per barrel. Interestingly, price currently trades exactly inside the “Value Line” or Midpoint Line at the $92.50 region.
From the weekly perspective, unless price finds sudden support at the important $90 to $92 level, a pathway opens up to the $82 level again which would be in line with the continued development of the larger rectangle pattern.
Of course, price did not break the $90 level with last week’s sell-off, so it will be the focal point going forward:
Next: The daily chart shows us the rally off the late June 2012 low
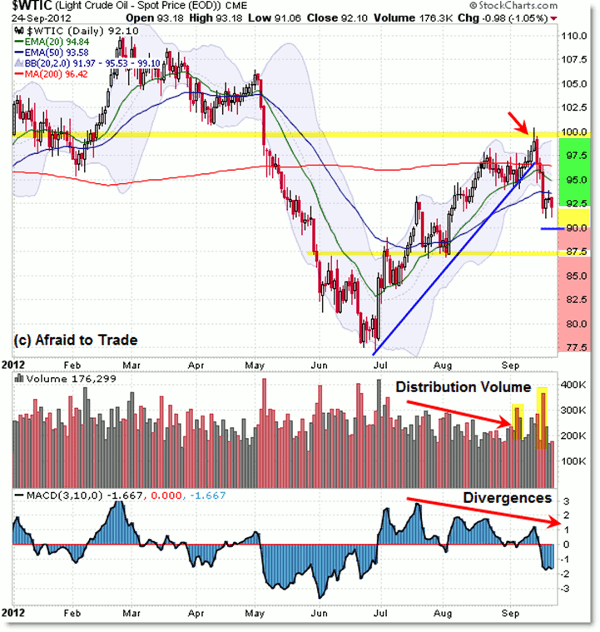
|pagebreak|The daily chart shows us the rally off the late June 2012 low from $77.50 to the $100 peak. There’s a great educational lesson regarding the distribution volume and lengthy negative momentum divergences that developed through the rally that corresponded with last week’s sharp sell-off from the $100 known target.
For now, the daily chart reminds us of the key levels to watch from here:
- $92.50 is the main focal point, with $90 as a “Round Number” potential support level.
- If this support fails, then $87.50 triggers as the next target.
- Under $87.50 aligns with the weekly chart pattern which would argue for a further sell-off toward the $82 level.
- However, unless proven otherwise soon, $92.50 is the key pivot to watch.
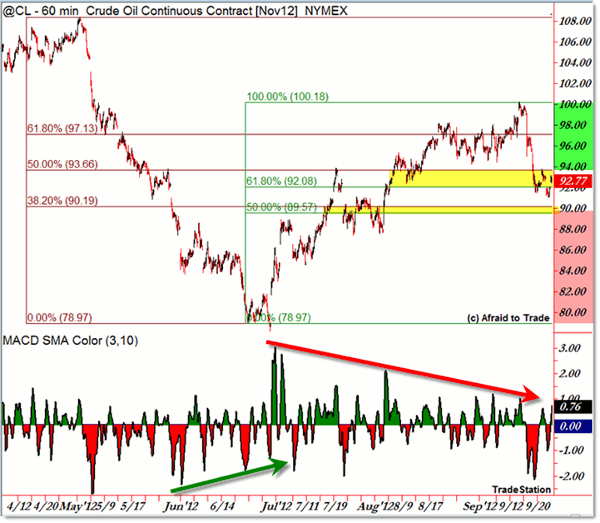
The intraday chart shows us near-term Fibonacci levels and a clearer picture of recent momentum:
I like using intraday charts, even from a swing-trading perspective, because it allows us to see more information at a glance.
The hourly chart revealed two clear momentum divergences—one positive divergence building into the early July inflection low and the other recent divergence undercutting the recent August rally.
I drew two simple Fibonacci Retracement Grids above. The red grid is an upward retracement against the May sell-off, while the green grid is a downward retracement against the recent rally from $80 to $100.
Two quick loose confluence (alignment) levels appear at $90 (which is also a simple “Round Number” reference), and of course the more important $92.50 level which plays into the weekly chart Midpoint Line.
The final analysis shows oil is in a key tipping point zone where buyers need to step in here at the critical $92.50 support, or else the market risks falling and breaking support all the way back to the $82 level again.
This week could go a long way to determining whether the next larger swing trading play in oil should target $100 (if support strongly holds) or $82 (if $90 then $87.50 both fail as support).
Corey Rosenbloom is a trader and blogger at AfraidToTrade.com.


