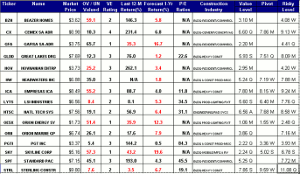
With the housing sector seemingly on the road to recovery, Richard Suttmeier provides a list of construction stocks for consideration on Equities.com.
The Construction Sector is 13.8% overvalued according to ValuEngine.com in an overall environment where there’s a near even split between the number of undervalued stocks vs. the number of overvalued stocks. Today I will screen through 38 construction stocks that are trading below $10 but above one buck to come up with a group of stocks to profile.
My first screen was a technical one. By looking at the daily charts for all 38 stocks I found that 12 had either spotty graphs or column gaps so I reduced the group to 26.
My second screen was to enter the symbols into the VE Institutional Software and one stock was not covered by ValuEngine.
Finally I built a spreadsheet with the fundamental data that I thought was necessary and ten stocks did not have enough data to calculate fair value levels, so I reduced the search to 15 names that I present in today’s table.
Reading the Table
OV/UN Valued: The stocks with a red number are undervalued by this percentage. Those with a black number are overvalued by that percentage according to ValuEngine. BZH is the most undervalued by 59.1%. GFA is the most overvalued by 65.7%.
VE Rating: A “1-Engine” rating is a Strong Sell, a “2-Engine” rating is a Sell, a “3-Engine” rating is a Hold, a “4-Engine” rating is a Buy and a “5-Engine” rating is a Strong Buy. <P/> 3 stocks are rated Strong Sell, 5 are rated Sell, six are rated Hold, and only one, CX, is rated Buy.
Last 12-Month Return (%): Stocks with a red number declined by that percentage over the last twelve months. Stocks with a Black number increased by that percentage. The best performer over the past twelve months is HOV with a gain of 262.1%. The worst performer over the past twelve months is SKY with a loss of 43.2%.
Forecast 1-Year Return: Stocks with a red number are projected to decline by that percentage over the next twelve months. Stocks with a Black number in the Table are projected to move higher by that percentage over the next twelve months. The best projected gain is 6.8% CX. The worst projected loss is SKY 19.6%.
P/E Ratios: Only ICA has a reasonable P/E ratio, while the others don’t have one, or the P/E ratio is extremely elevated.
Value Level: is the price at which to enter a GTC Limit Order to buy on weakness. The letters mean; W-Weekly, M-Monthly, Q-Quarterly, S-Semiannual and A- Annual.
Pivot: A level between a value level and risky level that should be a magnet during the time frame noted.
Risky Level: is the price at which to enter a GTC Limit Order to sell on strength.
By Richard Suttmeier on Equities.com.


