

Trader and blogger Brian Lund of BCLund.com shares the charts of some stocks that have held up well during this recent drop.
In last week’s post, I said that…“A lot of charts are looking “heavy,” especially in the pharma sector, however, after the selling last week I would expect a 1-2 day bounce, which may set up some good shorting opportunities.”
And that is exactly what happened in the indexes, various stocks, and specifically AAPL.
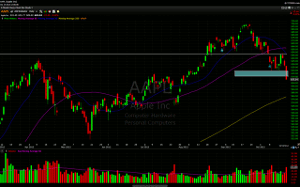
AAPL
Click to Enlarge
Last Monday AAPL bounced right off the support at the top of the blue rectangle, then failed at resistance on Wednesday, and sliced through all support to end the week on the lows. After three days of selling look for a bounce, but AAPL does seem like it has a date with its 200ma.
The name of the game this week is “relative strength.” We are looking for stocks that have held up well in this recent drop to A) day trade long, if the market gets another bounce and B) keep an eye on to swing trade long in a few weeks, if the overall indexes have stabilized and set up bullish patterns.
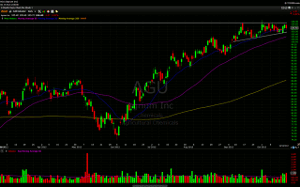
AGU
Click to Enlarge
You want to talk strength, well here it is. AGU is not only holding up while the market tanks, but is holding up while others like POT, MON, MOS in its own sector look weak or like shorts. In addition, it’s knocking at the door of all-time highs.
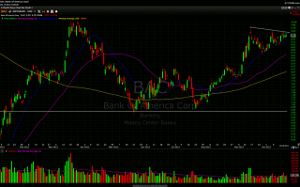
BAC
Click to Enlarge
NEXT PAGE: Four more charts showing relative strength. |pagebreak|
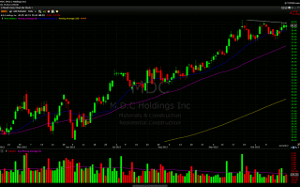
MDC
Click to Enlarge
Homebuilders like LEN, KBH, PHM were not deterred by last week’s selling. MDC is in the same sector and its chart looks good here.
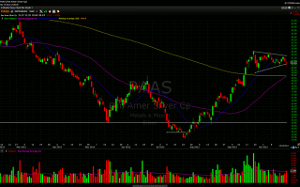
PAAS
Click to Enlarge
SLV sold off over the last two weeks, but PAAS has shown good relative strength. If the metals bounce, look to this one to break out.
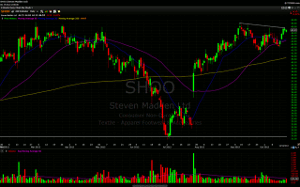
SHOO
Click to Enlarge
X
Click to Enlarge
NEXT PAGE: Last three charts showing relative strength. |pagebreak|
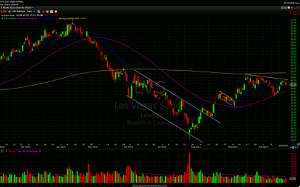
LVS
Click to Enlarge
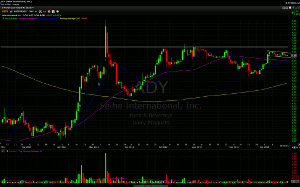
ADY
Click to Enlarge
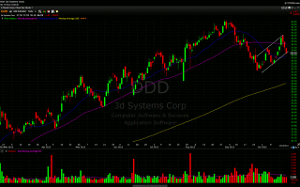
DDD
Click to Enlarge
3D printing will change our lives in ways we can’t even imagine, but right now, after breaking its uptrend and forming this rising channel, DDD looks like a short sell if it can get a weak 1-2 bounce at the bottom of the channel.
Brian Lund can be found on BCLund.com.


