With platinum pushing gold from the headlines in recent months and grains moving to the forefront again as spring planting nears, Lindsay Hall of Rutsen Meier Belmont (RMB) Group highlights a few trading ideas.
I want to start this week off by revisiting platinum and then looking at numbers and patterns to watch for longer-term potentials in two of the grains.
Platinum
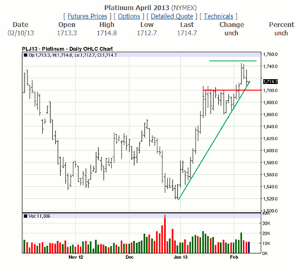
Back on January 28, I asked you all to watch platinum for a break upwards while it was sitting around $1697. It rallied per expectations and pushed upwards into the $1740’s.
If you look at the daily chart, we have now seen some retracement downwards from those recent highs, which may allow us new opportunities on the bullish side of platinum. Watch to see if the trendline on the daily chart holds. It would be best if platinum can hold its price above $1700 without a real breakdown of that level. In addition, watch to see should we get new bullish momentum if we can challenge and potentially break the $1750 threshold as that is our next big number that we need to push through.
Soybeans
I want to keep an eye on soybeans as we have seen a nice downward push that may potentially continue over time per potential longer-term chart patterns.
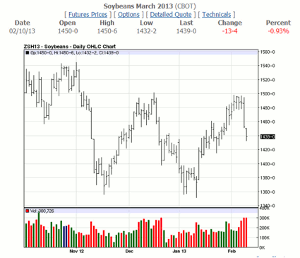
The daily chart shows the recent dramatic failure over the last couple of days after making an attempt to test the very significant 1500 level. This type of failure and the momentum present far exceeds the amount of momentum that soybeans were able to gain on the days where upward momentum was present. As such, soybeans are showing a propensity for failure and the short side of the market is the side to watch.
Due to the fact that we have seen such failure over the last couple of days, it is extremely important to be aware that there might exist the ability for this to stall and retrace a little. If this occurs, watch and wait for new downward momentum to evaluate trades that fit your profile.
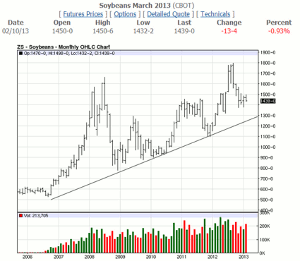
Also, pay close attention to the monthly chart to see whether or not we develop a head-and-shoulders pattern here. If we become bearish on a longer term, larger scale, we want to watch the 1300 territory to see if it is broken down and if it is, we may even see a return to test 1100. Again, this is from a larger picture perspective as far as potential is concerned and could take weeks or even months to develop.
Oats
Continuing in the train of thought of longer-term trading potential, I want to highlight a multi-year range that might be worth watching over the next number of weeks and months for potential break capability.
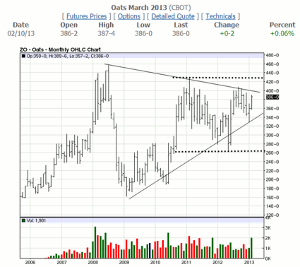
When looking at the monthly chart for oats, you’ll notice that our broad multi-year range runs from the 260 territory for lows upwards to the 430’s for highs. In addition to the multi-year channel, we have a bit of a triangular formation that is tightening seemingly with more momentum to the upside than towards our prior lows.
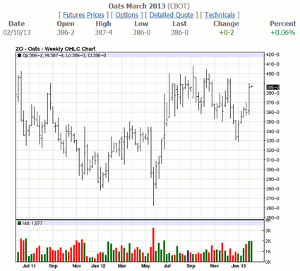
Our weekly chart magnifies the latest bullish energy for oats as we try to roll up to test 400.
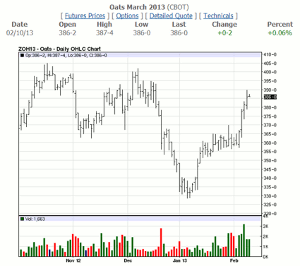
When we look at the daily chart, we can see just how much bullish energy we have had in this market over the last few weeks. As we have seen solid pushes upwards in the last number of days, be prepared for a bit of consolidation or retracement. If this occurs, wait patiently for the next bullish signals. Watch the 400 levels and the larger time frame charts for potential breaks that could lead to longer-term trading opportunities.
By Lindsay Hall, Chief Market Strategist, Rutsen Meier Belmont (RMB) Group


