After reviewing over a thousand charts, Greg Harmon of Dragonfly Capital has found some good setups for this week.
These charts were selected and should be viewed in the context of the broad Market Macro picture reviewed Saturday which, heading into the March Options Expiration Week sees the equity markets feeling a bit euphoric.
Elsewhere gold looks to continue to consolidate with a downward bias while crude oil slowly decides if it wants to move back higher. The US Dollar Index seems strong like a lion while US Treasuries play the part of the lamb. The Shanghai Composite is set up to continue to trend lower in the longer scale uptrend while emerging markets consolidate with a bias to the upside.
Volatility looks to remain very low keeping the bias higher for the equity index ETFs: SPY, IWM, and QQQ, despite the strong moves higher recently. A reversal in US Treasuries could derail the equity rally, and it would not be a surprise if the SPY and IWM consolidated or pulled back a bit in their trends higher. Use this information as you prepare for the coming week and trad’em well.
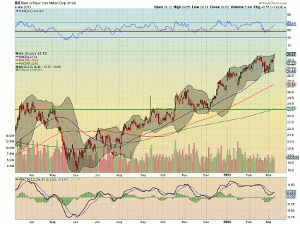
Bank of New York Mellon (BK)
Bank of New York Mellon (BK) is breaking higher over resistance at 28.25 after moving off of the 50-day simple moving average (SMA). It has support for a move higher from a rising and bullish relative strength index (RSI) and a moving average convergence divergence indicator (MACD) that is turning up and just crossed to positive on the histogram. Both support further upside.
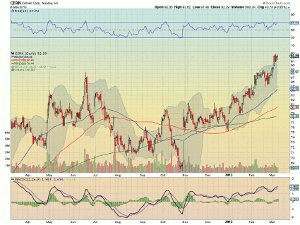
Cerner (CERN)
Cerner (CERN) is consolidating the move higher from the 20-day SMA in an ascending triangle under 93. The measured move higher over the triangle takes it to 95 and then 101. The bullish RSI and the rising MACD support further upside movement.
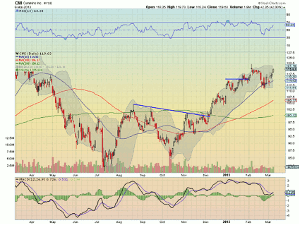
Cummins (CMI)
Cummins (CMI) fell back from consolidation to the 50-day SMA before rising back to the level. It has a rising and bullish RSI and a MACD that is curling up on the signal line and positive on the histogram to support more upside.
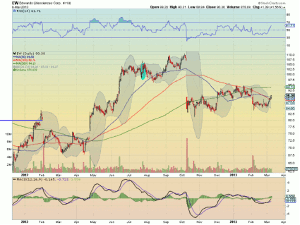
Edwards Lifesciences (EW)
Edwards Lifesciences (EW) consolidated a move lower at 85 before rising to end last week. Now at resistance, it has a RSI that is rising and bullish and a MACD that is moving back higher on the signal line and positive on the histogram to support further upside. A move over 95 sends it into the gap higher.
Ford (F)
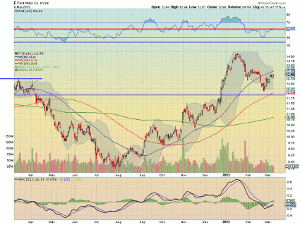
Ford (F) pulled back from a top in January and bottomed at 12.102 weeks ago. Now rising again, it is nearing the 50-day SMA and resistance with support for a move higher from a rising and bullish RSI and a MACD that rolling back higher on the signal line and positive on the histogram.
By Greg Harmon of Dragonfly Capital


