

Asset prices can correct in a hurry when sentiment shifts for reasons that may not be clear at first when support levels are broken, and emotional selling takes over, notes the staff at Briefing.com.
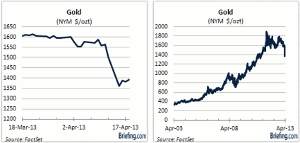
Gold, otherwise known as the yellow metal, has been left black and blue by recent selling interest. Last Monday, gold prices plummeted 9.3% on top of a 4.1% decline the previous Friday. That marked the largest two-day drop in gold prices in 30 years. Wait, though, it gets worse.
At its intraday low on Monday, gold was down nearly 17% from its closing level on April 1 and down 30% from the nominal, all-time high it reached in August 2011.
Not surprisingly, a litany of adverbial reports got published examining the where, what, when, why, and how of the historic gold trade. Theories ranged from central bank selling to forced liquidation to giving up on gold as an inflation hedge.
The theories were all plausible, yet none were singularly definitive.
The simple fact of the matter is that no one knows exactly why gold prices crashed. What should be clear to all investors in the shining example set by gold, though, is that asset prices go down a lot faster than they go up.
The latter isn't a novel revelation. Rather, it is a prudent reminder that fits the theme of risk control we have been emphasizing for some time.
No Other Alternatives
A popular adage in the capital markets is that "the trend is your friend." That applies to both uptrends and downtrends, yet the biggest friend to investors in recent years has certainly been the uptrend in stock prices.
That uptrend has been underpinned by the Federal Reserve's extremely accommodative monetary policy. That policy features a fed funds rate that has been at the zero bound since December 2008 and an open-ended purchase program of agency debt, agency MBS, and Treasury securities that is at $2.9 trillion and counting.
With that policy, the Fed is effectively encouraging investors to buy higher-yielding assets like stocks, junk bonds, and corporate bonds since it is suppressing real rates on benchmark government securities.
The primary motive expressed by the Fed is that it is driving down long-term rates in an effort to stimulate increased economic activity that will help the Fed meet its dual mandate of maximum employment and price stability.
We don't doubt the Fed's primary motive even though we question its effectiveness. What leaves us concerned is how extended the stock market risks getting on the Fed's ulterior motive.
NEXT PAGE: Did Margin Calls Cause Gold Crash?
|pagebreak|Increasingly, we are hearing laments and recommendations that are one in the same. Specifically, we are hearing that low-yielding government securities leave no other alternative than to buy higher-yielding stocks.
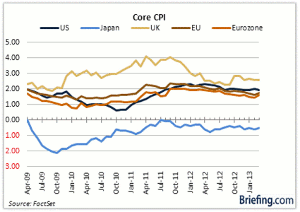
It reminds us of a time when we heard so many pundits lament and recommend that investors had to own gold because the easy-money policies of the Federal Reserve and other central banks were certain to produce rampant inflation. Those pundits may be proven right eventually, yet the chart below shows rampant inflation has yet to pass QE1, QE2, and QE3 go.
Click to Enlarge
To be fair, as stunning as the crash in gold prices was, a ten-year chart makes it clear that a lot of holders of gold are still sitting on some nice fiat paper gains.
The brunt of the recent selling has been borne by those who have bought gold over the last two years in particular. Of course, that is the natural order of things when a crash or major correction happens. The ones that get in last are the first ones to feel the real pain. The pain is even more acute for the ones who used leverage to chase a winning trade they previously missed.
Click to Enlarge
Crying Data, Not Wolf
One theory advanced explaining the expeditious drop in gold prices, and the difficulties in the stock market last week, is that the selling fed on itself due to margin calls. To be clear, the margin calls were on gold, not on stock, yet stocks presumably got caught up in that mix as holders of gold raised funds to meet those margin calls by selling stocks.
Again, that is just a theory. What stock investors should take note of, however, is the implication that losses can mount quickly when margin calls arrive and forced liquidation occurs to meet those calls.
That lesson was taught in 2000 with the popping of the technology bubble and in 2008 in the throes of the financial crisis that followed the popping of the housing bubble.
We feel obligated to remind readers of those painful periods because NYSE data indicate that participants are increasingly buying stocks on margin and don't have the cash on hand to meet margin calls made on speed dial.
We have discussed that circumstance in The Big Picture in the past, with the most recent entry being our March 11 article, Margin Debt Rises into Thin Air.
An updated look at margin account credit balances reveals the deficit of cash on hand to meet margin calls came down slightly in February versus January. Still, it stood at a lofty $70.3 billion. That is the second month in a row that it topped $70 billion.
The only other times in the last ten years that the deficit in credit account margin balances exceeded $70 billion was in March-April 2011, or shortly ahead of a 19% correction in the S&P 500 that stemmed from the debt ceiling debacle, and in June 2007, which preceded the peak in the S&P 500 four months later.
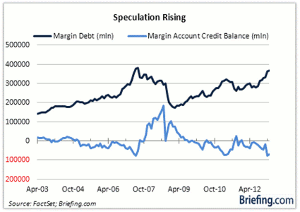
Click to Enlarge
NEXT PAGE: Trend is a Fickle Friend
|pagebreak|We can be accused of crying wolf in that we have presented this data on margin account balances in the past in the context of being a potential warning signal for the market. Yet, the market has simply marched on to new record highs without any serious setback.
Our only aim, though, is to highlight for our readers that they need to be hedged for unpredictable developments with a negative orientation. Such developments could trigger a wave of selling interest that feeds on itself due to forced liquidation to meet margin calls.
The data indicate, too, that there has been enough buying on margin to make it an identifiable market risk.
What It All Means
Gold will continue to hold appeal for many investors. Warren Buffett won't be one of them, but, hey, to each their own.
Why gold prices collapsed recently is anyone's best guess. There are fundamental reasons why it could have happened. There are technical reasons that could help explain it. And there are philosophical reasons that could have come into play.
We don't have any new theory to add on the yellow metal's bruising retreat. What we saw in the selling, though, was an important lesson for investors buying stocks in a market where the uptrend has been their friend and has instilled a complacent sense of security in that friendship.
Asset prices can correct in a hurry when sentiment shifts for reasons that may not be altogether clear at first, when support levels are broken, and when emotional selling takes over.
In speaking of the gold crash, our senior market analyst, Brett Manning, made this cogent observation: "I have learned over the years to look for absurd moves in the metals when they break key support. It happens because they are really such tiny, tiny markets. And yet, so many inexperienced traders participate in them, and all basically on the long side."
The stock market isn't tiny, but the commonality is that most investors participate on the long side. That's all well and good when the fundamental support structure is strong. However, when cracks start to appear, like they are now with the weak revenue growth, the sharp declines in base metal prices, and softening economic data, the chances of a trend reversal increase.
That reversal may not happen instantaneously with the Fed's current policy still influencing things, yet it behooves investors nonetheless to manage against the risk of it happening so they aren't left feeling black and blue in the event it does.
The trend may be your friend, but remember, stock market history has demonstrated it is a fickle friend.
By the Staff of Briefing.com


