

A lot of traders use the short ratio to find stocks that could rebound on any hint of an upswing, and that's one of the tools that the staff at Kapitall.com use to screen for these stocks.
This list looks at stocks reporting earnings next week that have been the subject of bullish attention from hedge funds and short sellers. Do you think an earnings surprise is in store?
To build this list, we started with a universe of stocks reporting earnings next week (May 20-24). We looked for an increase in buying from institutional investors, with significant net institutional purchases over the last quarter representing at least 5% of share float. This indicates that hedge fund managers and mutual fund managers expect the upside.
Next, we looked for some degree of optimism from short sellers, with a decrease in share float month over month of at least 1%. This may not seem like much, but in each case the short floats are significantly high, making them
Three stocks met all the criteria and are listed in detail below.
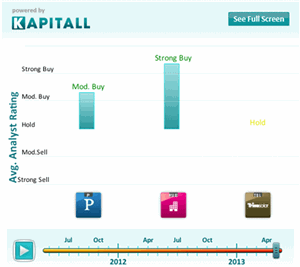
Click to Enlarge
Earnings season is winding to a close but there is still time to make some plays. Do you think these names have the potential to surprise next week? Use this list as a starting point for your own analysis.
1. Pandora Media, Inc. (P): Operates as an Internet radio company in the United States.
Market cap at $2.72B, most recent closing price at $15.58. Reporting on May 23.
Net institutional purchases in the current quarter at 31.1M shares, which represents about 25.65% of the company's float of 121.25M shares. Top holders are JP Morgan Chase (8.03%) and Susquehanna International Group (6.39%).
Shares shorted have decreased from 37.03M to 35.29M over the last month, a decrease which represents about 1.44% of the company's float of 121.25M shares. Days to cover ratio at 6.67 days. This may not seem like a significant percent change, but with a 21% float short, any good news surrounding earnings could propel a short squeeze.
Pandora has a history of reporting higher than estimated earnings: In April 2012: Reported EPS at -0.09 vs. estimate at -0.18 (surprise of 50%). In July 2012: Reported EPS at 0 vs. estimate at -0.03 (surprise of 100%). In Oct 2012: Reported EPS at 0.05 vs. estimate at 0.01 (surprise of 400%). In January 2013: Reported -0.04 vs. estimate at -0.05 (surprise of 20%. [Average earnings surprise at 142.5%]. Could Pandora continue its streak this quarter?
Using automated sentiment analysis from Contextuall we see that recent headlines have been overwhelmingly bullish for Pandora. 34 of the last 100 related headlines have been positive versus 15 negative and 51 neutral, although this is over a time span of several months. Forces driving this optimism include the recent hire of Tommy Page as Vice President, Artist and Brand Partnerships. He is a former record-company executive and a publisher at Billboard. It's said Pandora is hoping to produce original content to differentiate itself from competitors.
NEXT PAGE: 2 More Stocks
|pagebreak|2. rue21, Inc.
(RUE): Operates as a specialty apparel retailer in the United States. Market cap at $810.41M, most recent closing price at $34.18. Reporting on May 20.Net institutional purchases in the current quarter at 2.1M shares, which represents about 15.15% of the company's float of 13.86M shares. Top holders are Wellington Management Company, LLP (9.89%) and Wasatch Advisors (8.38%).
Shares shorted have decreased from 3.34M to 3.20M over the last month, a decrease which represents about 1.01% of the company's float of 13.86M shares. Days to cover ratio at 13.57 days. The stock has a share float of 13.04%, higher than the apparel store industry average of 6.37%.
Rue21 has shown some impressive accounting trends that may be attracting hedge funds. This includes:
High Return on Investment (Trailing 12-Month ROI is at 25.29% vs. an industry average at 16.49%.)
Rising profits: Diluted normalized EPS increased from 0.96 to 1.22 during the first time interval (52 weeks ending 2011-01-29 vs. 52 weeks ending 2010-01-30). For the second time interval, diluted normalized EPS increased from 1.22 to 1.56 (52 weeks ending 2012-01-28 vs. 52 weeks ending 2011-01-29). And for the last time interval, the EPS increased from 1.56 to 1.77 (53 weeks ending 2013-02-02 vs. 52 weeks ending 2012-01-28).
3. Trina Solar Limited (TSL): Designs, develops, manufactures, and sells photovoltaic (PV) modules worldwide. Market cap at $452.21M, most recent closing price at $5.73. Reporting on May 20.
Net institutional purchases in the current quarter at 3.8M shares, which represents about 5.56% of the company's float of 68.39M shares. Top holders are Franklin Resources (15.39%) and Platinum Investment Management (12.40%).
Shares shorted have decreased from 19.14M to 16.15M over the last month, a decrease which represents about 4.37% of the company's float of 68.39M shares. Days to cover ratio at 5.37 days. Float short at 20.7%.
Trina had been performing well, boosted by reports of solar panel price increases and better margins. The stock's average daily alpha vs. the S&P500 index stands at 1.61% (measured close to close, over the last month). During this period, the longest winning streak lasted seven days (i.e. the stock's daily returns outperformed the S&P 500 for seven consecutive days). The longest losing streak lasted two days (i.e. a win streak/losing streak ratio of 3.5).
However, prices are now dropping again on new concerns about European tariffs
A
*Short and price data sourced from Yahoo! Finance, institutional data from Fidelity, all other data sourced from Finviz.
Find more stock analysis and screens at Kapitall.com


