Oil, and its accompanying energy stocks and ETFs, is probably the third most widely followed trading instrument in the world (behind stock indices and gold), writes Moby Waller of BigTrends.com.
Crude oil has really been somewhat quiet now for several years in the big picture, but something may be “bubbling up” soon for energy stocks.
We'll look at the US Crude Oil ETF (USO), crude oil continuous futures, SPDR Energy Select ETF (XLE), and Market Vectors Oil Services ETF (OIH) as some of the most widely followed ETFs in this field—and each does have a different story to tell. All of the charts here are stripped down of most indicators to see the major trendlines and patterns.
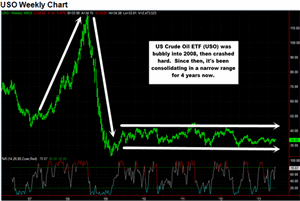
First the big picture on USO, see the first chart below. Here you see the parabolic bubble that developed in 2007 and crashed hard in 2008. Since then, USO has basically been in a narrow sideways range for four years now.
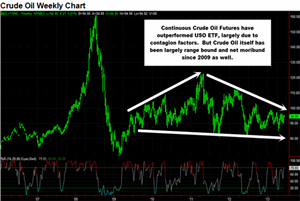
Now, USO does tend to lag the underlying crude oil continuous futures in performance. This is largely explained by most due to the contango in the ETF's makeup and rules—something to keep in mind if you're a long-term investor in USO (as a shorter-term trader, it's not as likely to be a major effect). See the long-term crude oil chart below, same bubble and crash as USO, but a much more defined recovery. That recovery has stalled, however, since 2011. But overall, we again see years of churning and consolidation, with some fairly clear trendlines.
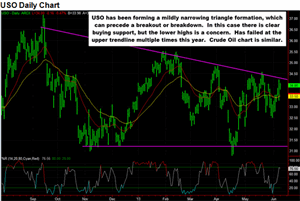
Zooming a little bit on USO, on the daily chart next below that goes back to mid-2012, there has been a mild narrowing formation going on. In this case, the lower highs form a downward slope to the consolidation—but they also have acted as resistance to rallies multiple times. There is a good support line of buying around the 31/31.5 area. A narrowing of this range and a breakdown of that support would be an indication of a further breakdown in USO (could take some time to develop). From there, 30 is the next line of support (also been a key technical area), but below that you're looking all the way down to 26/25 or even lower from the 2008/2009 lows and key levels. If the trendline formation is broken to the upside and USO breaks out, the 36 area is the first likely target, beyond that lies the 40 strike which has been key several times in recent years.
NEXT PAGE: Energy Stocks & ETFs Looking Bullish
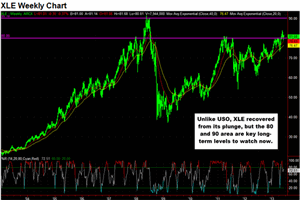
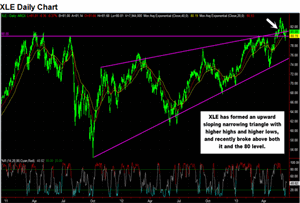
|pagebreak|Now on to the most widely known ETF for energy stocks—XLE. On the long-term XLE chart below, note that it recovered nicely from the plunge, reaching old key levels by the beginning of 2011. You can see 80 and 90 are important levels on XLE going back many years. Note that XLE has recently taken out 80, where it failed previously several times.
Side note, we often focus on the round levels and strike prices, using 80 for example rather than 80.14…we've discussed this previously, but for longer-term analysis, the round number area itself is appropriate to focus on, it's usually not necessary to go out to decimal point specifics. Also, round numbers and key levels are watched by many people and are psychologically, technically, and sentiment-wise important and can become self-fulfilling prophecies at times. Finally there is the matter of option open interest, which can affect a stock/ETF/index around those key levels due to market maker delta/gamma hedging and other factors.
Zooming in on XLE a bit to the daily chart since early-2011, you can see below that it is also forming a narrowing range pattern—but in this case it is to the upside. Higher highs and higher lows form this since October 2012—not a steep angle on the narrowing (some might view this as more of a trend channel), but it is there.
Note in early-May, we just broke above both the upper trendline and the 80 level—and since came back and tested that level and have resumed higher just in the past two trading days. This looks like a fairly significant breakout occurring. And there isn't much overhead resistance to worry about on the way to 90 (the 83 and 85 levels are targets along the way).
Another major energy stock ETF is OIH. Despite one being “energy services” and one “energy,” OIH and XLE actually have some similar holdings and performance with a couple big exceptions: 31% of XLE is in Exxon Mobil (XOM) and Chevron (CVX) with the third biggest holding being Schlumberger (SLB)—while OIH has 19% in “Schlum-Dog” (as we used to call it on the trading floor) as its biggest holding and doesn't hold XLE and CVX. That in itself explains most of the difference in performance in the two ETFs.
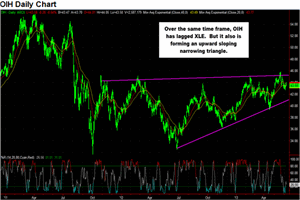
Anyway, see on the OIH daily chart below covering the same time frame as the XLE daily, it has lagged. XLE has reached (and now overtaken) its 2011 levels, while OIH is 10+ points below those levels. But OIH is also forming an upward sloping pattern. This, too, looks likely to be broken to the upside.
Bottom Line: Crude oil has been consolidating for some time now. USO is narrowing and may break down a bit shorter-term. But even with the rather moribund performance of oil, energy stocks are charting their own course. XLE has just broken to multi-year highs and OIH is forming a bullish looking pattern. Remember that these are longer-term charts (even the daily ones cover quite a bit of ground), so keep an eye on these narrowing formations we've pointed out and look for breakouts/breakdowns of key support and resistance levels.
by Moby Waller, Co-Portfolio Manager, ETFTRADR and Rapid Options Income, BigTrends.com


