

The staff at Briefing.com puts together a list, which features names in their proprietary Focus List of the most liquid, high relative strength stocks in the market that are ideal for day and swing trading candidates.
Among the highlighted charts below, we show a handful of stocks that have succumbed to recent selling pressures and have some questionable patterns around their intermediate-term uptrends, support zones, and 50-day moving averages, which could "make or break" them in July.
Recall that our Focus List is designed to seek out the strongest stocks from both a fundamental and technical standpoint, however, even during bear cycles or corrective phases, they can become very susceptible to corrections as well. Be especially careful with those names that have ran significantly higher the last few weeks and are extended well above key moving averages. Also be cautious with those leaders breaking below their 50-day MA's and are struggling to recoup/bounce as they could be setting up for another leg lower.
Chart Analysis
ALKS - Questionable activity as price slumps back under its 50-day and 20-day moving averages, shifting the burden of proof on buyers.
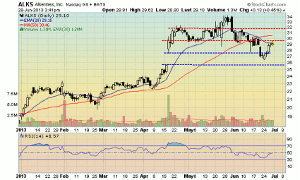
Click to Enlarge
CERN - A broken long-term uptrend line with price action below the 50-day MA is a "red flag." The late April bullish gap held support, but there's potential for another leg down to develop if the broader market corrects.
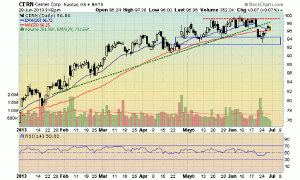
Click to Enlarge
COH - That tight range along May/June highs resulted in a breakdown recently under 57 support and the 50-day MA. Buyers stepped in upon price probing its late-April bullish gap and bounced price back to the 50- and 20-day MA's. Okay for now, but definitely an "inflection point" around 57/58 that can lead to further upside or downside in July.
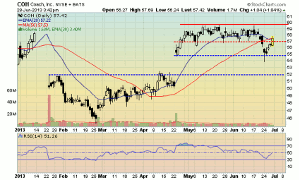
Click to Enlarge
FLT - A longstanding member of our LQDXX and GROWX Focus Lists, FLT started to show some relative weakness this week on high volume. The 50-day MA appear to be holding for now, but last Thursday's aggressive rejection along the 20-day MA while the broader market rallied was a "red flag." Be cautious of further downside into that early May bullish gap around 77/80.
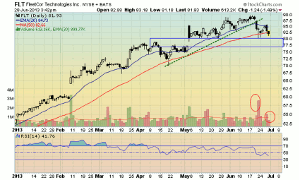
Click to Enlarge
HLF - Plenty of mixed opinions out there on this leading name, but technically it's holding up fairly well with a narrowing range consolidation pattern the last couple of weeks. More impressive is the 50-day MA bounce this week, suggesting buyers are still interested in it. As the "symmetrical triangle" pattern narrows, traders should be on watch for a breakout/breakdown for an opportunity.
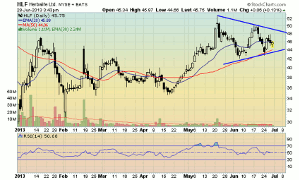
Click to Enlarge
LNKD - A leading Internet name atop our Focus List, LNKD has been in a "holding pattern" the last two months just below and around its 50-day MA. Keep on the radar for a potential breakout/squeeze above two-week highs for a move into that early May bearish gap, but also be wary if price starts to drop back under the 20-day MA under this week's lows.
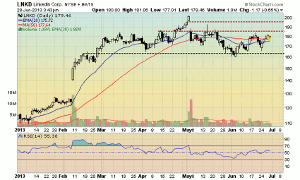
Click to Enlarge
NEXT PAGE: The 50 Most Liquid Stocks
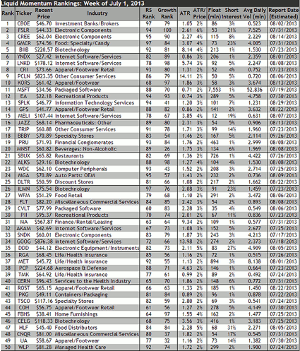
|pagebreak|Liquid Momentum Rankings
With equity markets always in motion and leadership rotating from one group to another, this list is designed to help active day and swing traders stay on top of the highest-quality trading names. It is generated from a proprietary algorithm that places heavy emphasis on superior relative strength versus the all-stocks universe, high average true range (ATR) values, and high average daily volume, among other data points. An updated list is published each Monday, along with charts and commentary throughout the week highlighting the most compelling set-ups and patterns.
ADDITIONS: AKAM, CBOE, CNQR, CVLT, EA, KORS, MSFT, UA
DELETIONS: AIZ, BRK.B, CMG, DIS, IACI, NKE, SLXP, TJX
Click to Enlarge
Liquid Momentum is Briefing.com's proprietary Focus List for the 50 most liquid, high relative strength stocks in the market that are ideal for day and swing trading candidates.
By the Staff of Briefing.com


