Sector rotation states that strength in offensive sectors suggest investor appetite for stocks, which tends to fuel an ongoing uptrend in the broader stock market, notes technician Corey Rosenbloom of AfraidToTrade.com.
In case you missed it, many retail and consumer discretionary stocks have been breaking either to new 52-week highs or new all-time highs, and we continue to see strength in the related ETFs.
Let's take a look at the breakouts in the retail ETF (XRT), broader consumer discretionary sector (XLY) and ponder what that suggests for the near-term future of the US stock market.
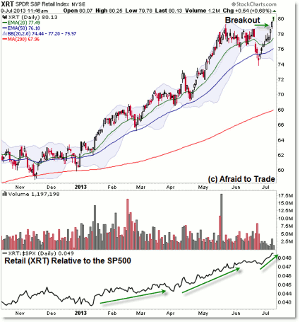
We'll start with a chart of the XRT retail sector SPDR ETF:

chart courtesy of StockCharts.com
Click to Enlarge
Keep in mind that as of Tuesday, the broader SP500 was NOT yet trading above its June 2013 high near 1,655 and is beneath its all-time high from the May 2013 peak near 1,680.
The retail ETF and many stocks within the retail sector are above both the June reference high and the May "all-time" or new recovery high points, demonstrating relative strength to the SP500 and other sectors in the market.
The XRT retail sector exchange traded fund is comprised of roughly 100 retail stocks with most stocks receiving a 1% weighting in the fund.
The middle panel shows volume (precariously diverging with the new price highs) while the lower panel measures "relative strength" to the SP500 (it's the XRT divided by the SP500 updated over time).
Rather than compare the value of the indicator, pay attention to the direction or trend of the relative strength relationship-retail has consistently outperformed the SP500 since the beginning of 2013, and in fact, the trend has accelerated throughout 2013 with the recent indicator peak.
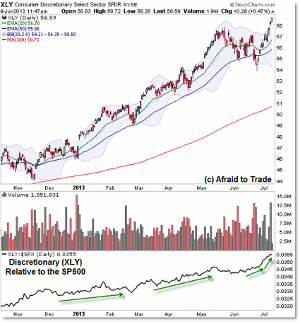
It's not just the retail sector itself; in fact, the broader consumer discretionary sector has also outperformed the SP500 stretching back to the November 2012 market lows:

chart courtesy of StockCharts.com
Click to Enlarge
Note the bull flag pattern that triggered with the recent breakthrough above the falling trendline into the $75 ETF level (corresponding with the breakthrough above the June 2013 high).
The ETF continued in breakout or impulse movement similar to what occurred during the late April/May period of 2013 (day-over-day upside activity).
Just like May, we've yet to see a true down day in the ETF since the mid-June low.
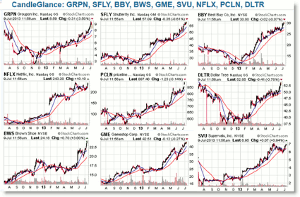
While the nine charts below are simply the XRT's nine largest holdings (by weight), they can provide a foundation to begin additional work to locate other names that show strength. These stocks would be expected to continue showing strength even with breakouts to new all-time highs in some cases.

chart courtesy of StockCharts.com
Click to Enlarge
Other popular names not in the Top Ten XRT Holdings but still in the fund include Amazon.com (AMZN), Netflix (NFLX), Gap (GPS), and Autozone (AZO)—all of which similarly broke to new 52-week or all-time highs this week.
For swing traders and even intraday traders, it's helpful to focus your attention on sectors that are outperforming the market, and then if you're up for a bit of extra work, pinpoint individual stocks within the sector that are outperforming other stocks in the sector.
According to the sector rotation model, strength in discretionary/retail or offensive sectors (including technology, financials, and materials) tend to suggest investor appetite for stocks, which tends to occur in a bull market or ongoing uptrend in the broader stock market.
As long as we continue to see strength in these names, it would be supportive of a continuation of the bull trend in stocks as the SP500 trades into its June high and then toward the next target of the May 2013 "all-time" high and perhaps beyond.
By Corey Rosenbloom, CMT, Trader and Blogger, AfraidToTrade.com


