Even as this bank giant delivered a solid earnings report last week, its charts have been impressive as well, notes technician Greg Harmon of Dragonfly Capital.
Bank of America (BAC) reported earnings Wednesday morning and the reaction was a jump higher in price. But now with earnings out of the way how does it look going forward? Actually the charts are set up for a very good run if it can just get a little kick start. Take a look.
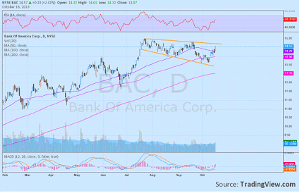
The daily chart above shows a wedge that has been building since mid July. The latest leg higher, now over all of the simple moving averages (SMA) is getting ready to hit the top of the wedge. This is the key to the story technically. That top wedge. A push through triggers a target on a pattern break on this daily chart to 16.50 on a measured move higher. It has support to at least test that top rail of the wedge from a bullish and rising relative strength index (RSI) and a MACD that is rising and positive. That could get it going.
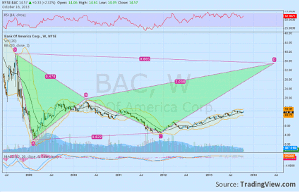
The weekly chart then gives some clues as to how much room it has to run in the intermediate term. The harmonic bat it is building carries a potential reversal zone (PRZ) all the way up at 35.21. But there is resistance 15.31 and 19.92 along the way, from the highs in early 2011 and 2010. This view also has a bullish RSI but with a MACD that has leveled after a pullback. If that initial move from the daily chart happens the MACD will likely rise to support more upside as well.
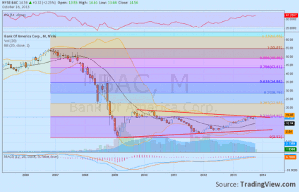
Stepping back further to the monthly view shows that there is some real upside potential. A move higher through the symmetrical triangle at 15 would trigger a target of 31.50. It would also take the stock over the 23.6% Fibonacci retracement that has been containing it since it fell back of the slight over shoot in 2010. A 38.2% retracement would bring it up to 22.58 and 50% retracement closer to that 31.50 level at 28.78, with resistance on this timeframe at 23.75 and then 34. You can see that the RSI and MACD are both rising on this timeframe to support more upside. Keep an eye on that daily chart and the 15 to 15.30 area.
By Greg Harmon of Dragonfly Capital


